Immigrants from Guatemala vs Spanish American Seniors Poverty Over the Age of 75
COMPARE
Immigrants from Guatemala
Spanish American
Seniors Poverty Over the Age of 75
Seniors Poverty Over the Age of 75 Comparison
Immigrants from Guatemala
Spanish Americans
15.1%
SENIORS POVERTY OVER THE AGE OF 75
0.0/ 100
METRIC RATING
287th/ 347
METRIC RANK
13.5%
SENIORS POVERTY OVER THE AGE OF 75
0.5/ 100
METRIC RATING
244th/ 347
METRIC RANK
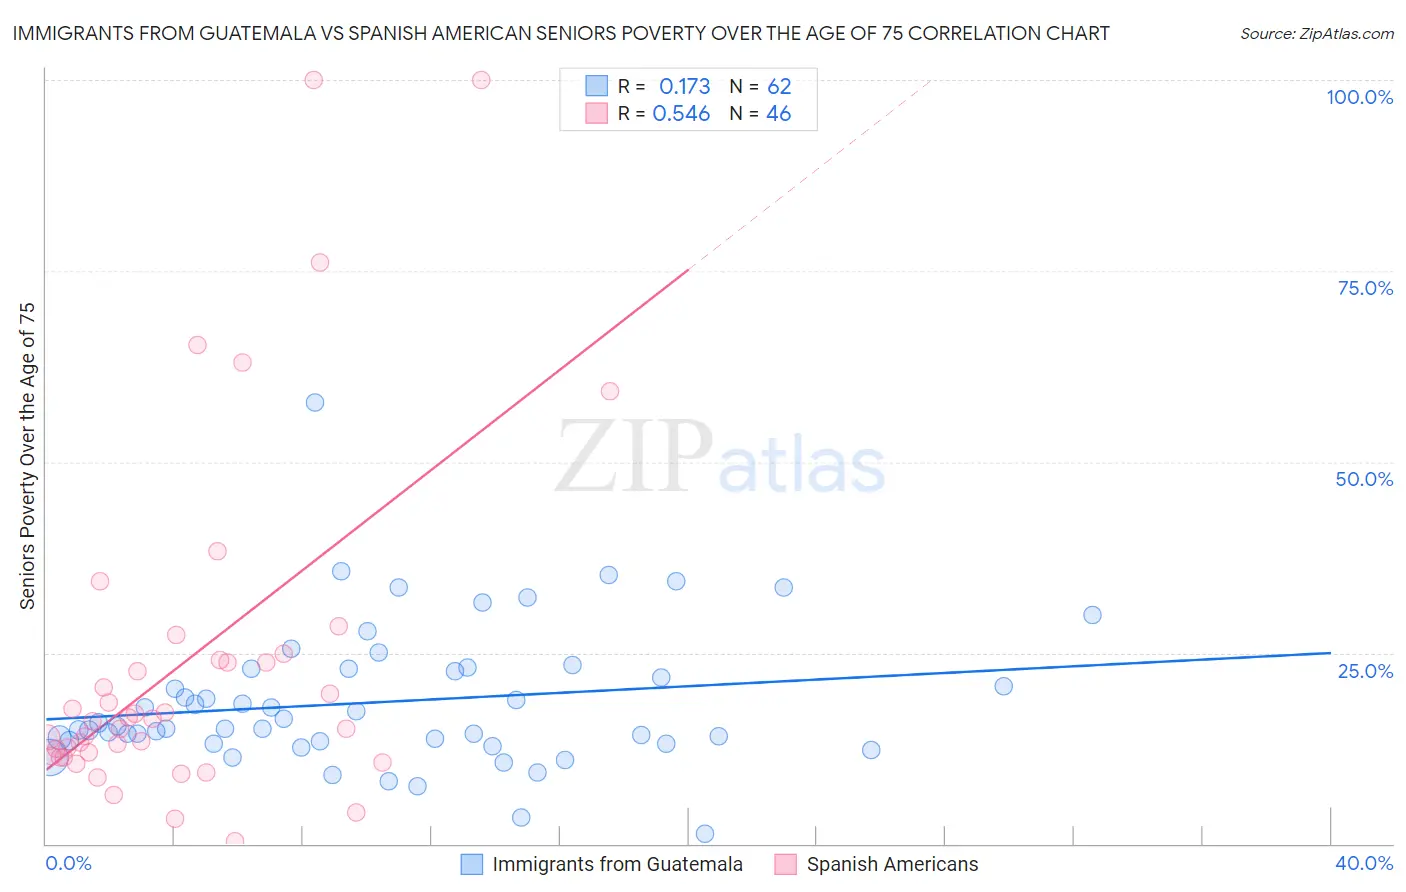
Immigrants from Guatemala vs Spanish American Seniors Poverty Over the Age of 75 Correlation Chart
The statistical analysis conducted on geographies consisting of 373,963,984 people shows a poor positive correlation between the proportion of Immigrants from Guatemala and poverty level among seniors over the age of 75 in the United States with a correlation coefficient (R) of 0.173 and weighted average of 15.1%. Similarly, the statistical analysis conducted on geographies consisting of 102,922,001 people shows a substantial positive correlation between the proportion of Spanish Americans and poverty level among seniors over the age of 75 in the United States with a correlation coefficient (R) of 0.546 and weighted average of 13.5%, a difference of 11.5%.
Seniors Poverty Over the Age of 75 Correlation Summary
| Measurement | Immigrants from Guatemala | Spanish American |
| Minimum | 1.2% | 0.28% |
| Maximum | 57.8% | 100.0% |
| Range | 56.5% | 99.7% |
| Mean | 18.6% | 24.0% |
| Median | 15.2% | 16.2% |
| Interquartile 25% (IQ1) | 13.4% | 11.5% |
| Interquartile 75% (IQ3) | 22.9% | 24.1% |
| Interquartile Range (IQR) | 9.5% | 12.6% |
| Standard Deviation (Sample) | 9.3% | 23.0% |
| Standard Deviation (Population) | 9.2% | 22.7% |
Similar Demographics by Seniors Poverty Over the Age of 75
Demographics Similar to Immigrants from Guatemala by Seniors Poverty Over the Age of 75
In terms of seniors poverty over the age of 75, the demographic groups most similar to Immigrants from Guatemala are Immigrants from Central America (15.0%, a difference of 0.59%), Jamaican (15.1%, a difference of 0.60%), Immigrants from Belize (15.2%, a difference of 0.86%), Immigrants from the Azores (15.2%, a difference of 0.88%), and Paiute (15.2%, a difference of 0.89%).
| Demographics | Rating | Rank | Seniors Poverty Over the Age of 75 |
| Central Americans | 0.0 /100 | #280 | Tragic 14.7% |
| Belizeans | 0.0 /100 | #281 | Tragic 14.8% |
| Immigrants | Senegal | 0.0 /100 | #282 | Tragic 14.8% |
| Guatemalans | 0.0 /100 | #283 | Tragic 14.8% |
| Cheyenne | 0.0 /100 | #284 | Tragic 14.9% |
| Immigrants | Mexico | 0.0 /100 | #285 | Tragic 14.9% |
| Immigrants | Central America | 0.0 /100 | #286 | Tragic 15.0% |
| Immigrants | Guatemala | 0.0 /100 | #287 | Tragic 15.1% |
| Jamaicans | 0.0 /100 | #288 | Tragic 15.1% |
| Immigrants | Belize | 0.0 /100 | #289 | Tragic 15.2% |
| Immigrants | Azores | 0.0 /100 | #290 | Tragic 15.2% |
| Paiute | 0.0 /100 | #291 | Tragic 15.2% |
| Colville | 0.0 /100 | #292 | Tragic 15.2% |
| Apache | 0.0 /100 | #293 | Tragic 15.3% |
| Immigrants | Jamaica | 0.0 /100 | #294 | Tragic 15.3% |
Demographics Similar to Spanish Americans by Seniors Poverty Over the Age of 75
In terms of seniors poverty over the age of 75, the demographic groups most similar to Spanish Americans are Uruguayan (13.5%, a difference of 0.14%), Dutch West Indian (13.5%, a difference of 0.32%), Immigrants from Somalia (13.5%, a difference of 0.34%), Immigrants from Cambodia (13.6%, a difference of 0.37%), and Immigrants from Russia (13.4%, a difference of 0.44%).
| Demographics | Rating | Rank | Seniors Poverty Over the Age of 75 |
| Alaskan Athabascans | 0.8 /100 | #237 | Tragic 13.4% |
| Peruvians | 0.8 /100 | #238 | Tragic 13.4% |
| Panamanians | 0.8 /100 | #239 | Tragic 13.4% |
| Argentineans | 0.7 /100 | #240 | Tragic 13.4% |
| Immigrants | Russia | 0.6 /100 | #241 | Tragic 13.4% |
| Immigrants | Somalia | 0.6 /100 | #242 | Tragic 13.5% |
| Dutch West Indians | 0.6 /100 | #243 | Tragic 13.5% |
| Spanish Americans | 0.5 /100 | #244 | Tragic 13.5% |
| Uruguayans | 0.5 /100 | #245 | Tragic 13.5% |
| Immigrants | Cambodia | 0.4 /100 | #246 | Tragic 13.6% |
| Immigrants | Ukraine | 0.3 /100 | #247 | Tragic 13.6% |
| Africans | 0.3 /100 | #248 | Tragic 13.6% |
| Immigrants | Albania | 0.3 /100 | #249 | Tragic 13.6% |
| Mexican American Indians | 0.3 /100 | #250 | Tragic 13.6% |
| Immigrants | Peru | 0.3 /100 | #251 | Tragic 13.7% |