Immigrants from Germany vs Cuban Child Poverty Among Boys Under 16
COMPARE
Immigrants from Germany
Cuban
Child Poverty Among Boys Under 16
Child Poverty Among Boys Under 16 Comparison
Immigrants from Germany
Cubans
16.2%
CHILD POVERTY AMONG BOYS UNDER 16
63.6/ 100
METRIC RATING
166th/ 347
METRIC RANK
17.9%
CHILD POVERTY AMONG BOYS UNDER 16
3.8/ 100
METRIC RATING
223rd/ 347
METRIC RANK
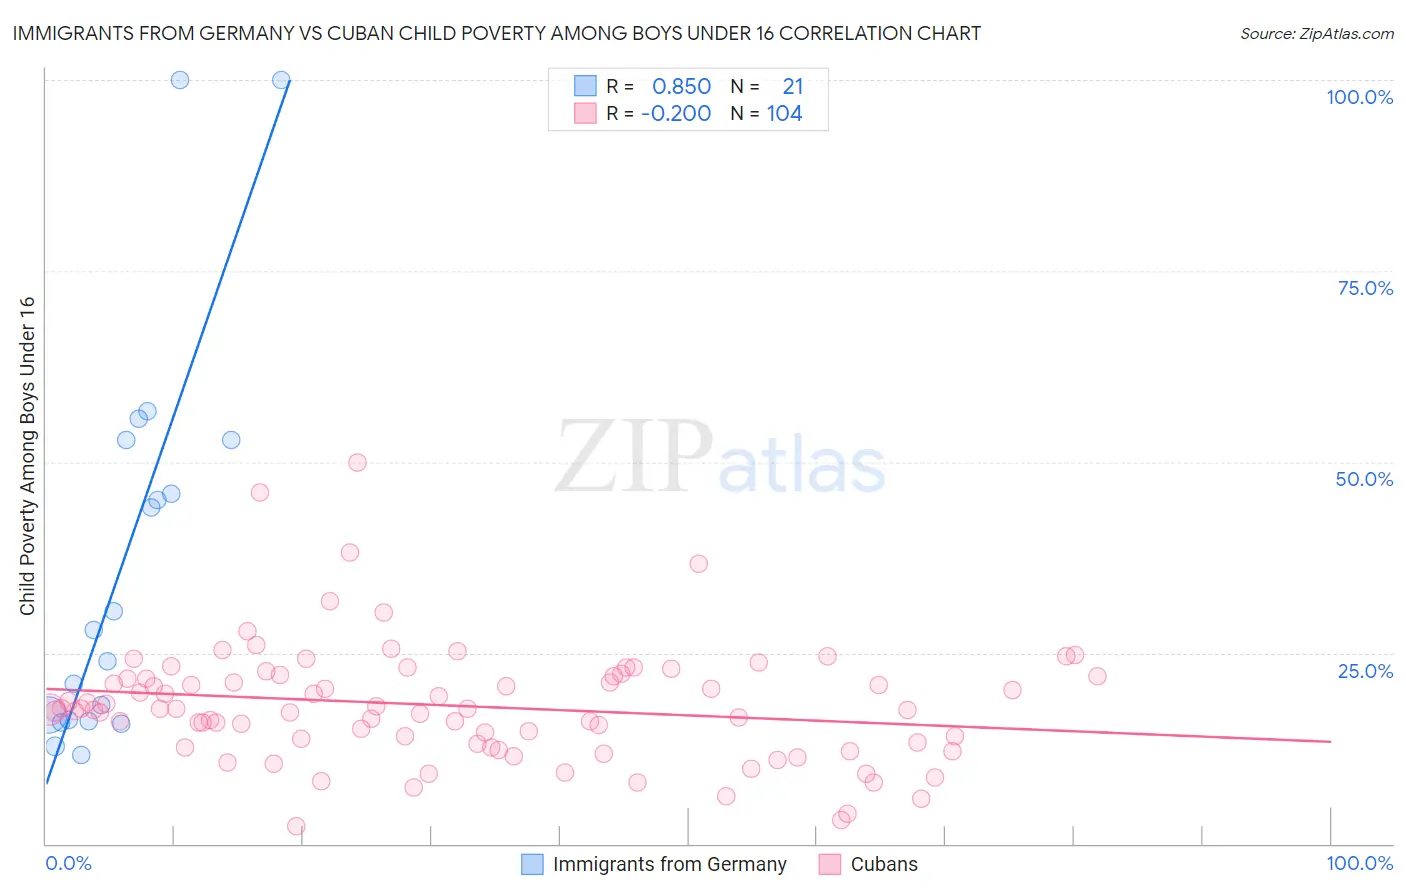
Immigrants from Germany vs Cuban Child Poverty Among Boys Under 16 Correlation Chart
The statistical analysis conducted on geographies consisting of 453,739,564 people shows a very strong positive correlation between the proportion of Immigrants from Germany and poverty level among boys under the age of 16 in the United States with a correlation coefficient (R) of 0.850 and weighted average of 16.2%. Similarly, the statistical analysis conducted on geographies consisting of 441,055,508 people shows a poor negative correlation between the proportion of Cubans and poverty level among boys under the age of 16 in the United States with a correlation coefficient (R) of -0.200 and weighted average of 17.9%, a difference of 10.7%.
Child Poverty Among Boys Under 16 Correlation Summary
| Measurement | Immigrants from Germany | Cuban |
| Minimum | 11.6% | 2.3% |
| Maximum | 100.0% | 50.0% |
| Range | 88.4% | 47.7% |
| Mean | 37.1% | 18.1% |
| Median | 28.0% | 17.6% |
| Interquartile 25% (IQ1) | 16.1% | 13.2% |
| Interquartile 75% (IQ3) | 52.9% | 21.9% |
| Interquartile Range (IQR) | 36.8% | 8.7% |
| Standard Deviation (Sample) | 26.2% | 7.7% |
| Standard Deviation (Population) | 25.5% | 7.7% |
Similar Demographics by Child Poverty Among Boys Under 16
Demographics Similar to Immigrants from Germany by Child Poverty Among Boys Under 16
In terms of child poverty among boys under 16, the demographic groups most similar to Immigrants from Germany are Colombian (16.1%, a difference of 0.20%), Immigrants from Albania (16.1%, a difference of 0.55%), Costa Rican (16.1%, a difference of 0.57%), Guamanian/Chamorro (16.1%, a difference of 0.77%), and Afghan (16.3%, a difference of 0.97%).
| Demographics | Rating | Rank | Child Poverty Among Boys Under 16 |
| Immigrants | Chile | 74.8 /100 | #159 | Good 15.9% |
| Immigrants | Northern Africa | 71.3 /100 | #160 | Good 16.0% |
| Immigrants | Oceania | 71.3 /100 | #161 | Good 16.0% |
| Guamanians/Chamorros | 69.6 /100 | #162 | Good 16.1% |
| Costa Ricans | 68.1 /100 | #163 | Good 16.1% |
| Immigrants | Albania | 67.9 /100 | #164 | Good 16.1% |
| Colombians | 65.2 /100 | #165 | Good 16.1% |
| Immigrants | Germany | 63.6 /100 | #166 | Good 16.2% |
| Afghans | 55.4 /100 | #167 | Average 16.3% |
| South Americans | 55.3 /100 | #168 | Average 16.3% |
| Immigrants | Saudi Arabia | 53.6 /100 | #169 | Average 16.4% |
| Immigrants | Bosnia and Herzegovina | 51.7 /100 | #170 | Average 16.4% |
| Immigrants | Ethiopia | 51.3 /100 | #171 | Average 16.4% |
| Immigrants | Colombia | 50.8 /100 | #172 | Average 16.4% |
| Tsimshian | 50.5 /100 | #173 | Average 16.4% |
Demographics Similar to Cubans by Child Poverty Among Boys Under 16
In terms of child poverty among boys under 16, the demographic groups most similar to Cubans are Pennsylvania German (17.9%, a difference of 0.090%), Immigrants from Panama (17.9%, a difference of 0.32%), Nepalese (18.0%, a difference of 0.47%), Immigrants from Cambodia (17.8%, a difference of 0.79%), and Inupiat (18.1%, a difference of 0.89%).
| Demographics | Rating | Rank | Child Poverty Among Boys Under 16 |
| Moroccans | 5.6 /100 | #216 | Tragic 17.7% |
| Japanese | 5.5 /100 | #217 | Tragic 17.7% |
| Iraqis | 5.5 /100 | #218 | Tragic 17.7% |
| Sierra Leoneans | 5.3 /100 | #219 | Tragic 17.8% |
| Immigrants | Cambodia | 5.1 /100 | #220 | Tragic 17.8% |
| Immigrants | Panama | 4.3 /100 | #221 | Tragic 17.9% |
| Pennsylvania Germans | 3.9 /100 | #222 | Tragic 17.9% |
| Cubans | 3.8 /100 | #223 | Tragic 17.9% |
| Nepalese | 3.2 /100 | #224 | Tragic 18.0% |
| Inupiat | 2.7 /100 | #225 | Tragic 18.1% |
| Immigrants | Africa | 2.6 /100 | #226 | Tragic 18.1% |
| Bermudans | 2.5 /100 | #227 | Tragic 18.1% |
| Immigrants | Nonimmigrants | 2.2 /100 | #228 | Tragic 18.2% |
| Immigrants | Micronesia | 1.8 /100 | #229 | Tragic 18.3% |
| Fijians | 1.8 /100 | #230 | Tragic 18.3% |