Immigrants from France vs Immigrants from Lebanon Child Poverty Among Girls Under 16
COMPARE
Immigrants from France
Immigrants from Lebanon
Child Poverty Among Girls Under 16
Child Poverty Among Girls Under 16 Comparison
Immigrants from France
Immigrants from Lebanon
14.9%
CHILD POVERTY AMONG GIRLS UNDER 16
96.2/ 100
METRIC RATING
96th/ 347
METRIC RANK
17.1%
CHILD POVERTY AMONG GIRLS UNDER 16
22.6/ 100
METRIC RATING
198th/ 347
METRIC RANK
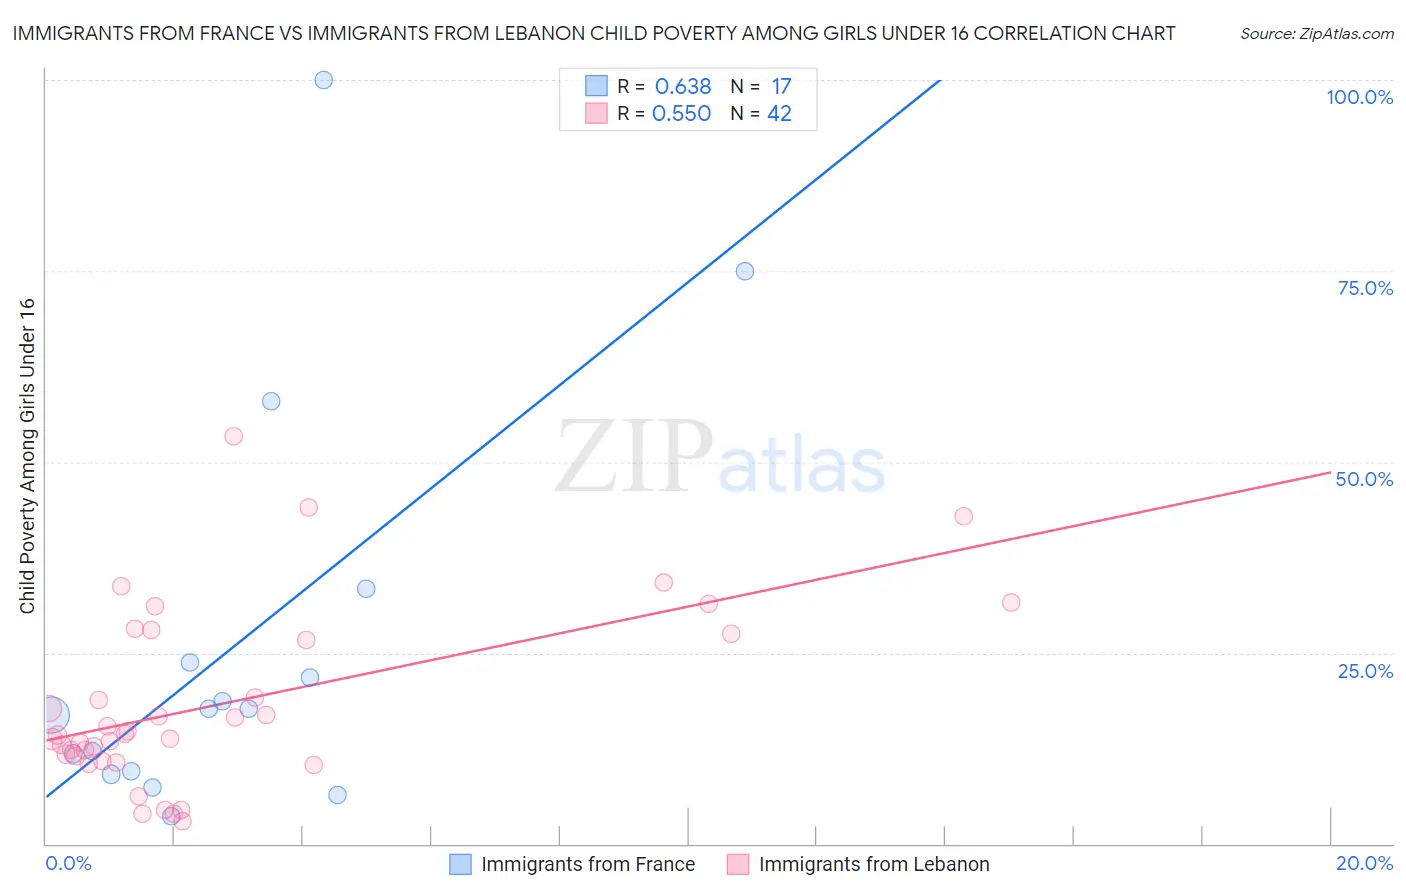
Immigrants from France vs Immigrants from Lebanon Child Poverty Among Girls Under 16 Correlation Chart
The statistical analysis conducted on geographies consisting of 283,385,338 people shows a significant positive correlation between the proportion of Immigrants from France and poverty level among girls under the age of 16 in the United States with a correlation coefficient (R) of 0.638 and weighted average of 14.9%. Similarly, the statistical analysis conducted on geographies consisting of 214,720,358 people shows a substantial positive correlation between the proportion of Immigrants from Lebanon and poverty level among girls under the age of 16 in the United States with a correlation coefficient (R) of 0.550 and weighted average of 17.1%, a difference of 14.2%.
Child Poverty Among Girls Under 16 Correlation Summary
| Measurement | Immigrants from France | Immigrants from Lebanon |
| Minimum | 3.6% | 2.9% |
| Maximum | 100.0% | 53.3% |
| Range | 96.4% | 50.5% |
| Mean | 26.0% | 18.4% |
| Median | 17.6% | 14.3% |
| Interquartile 25% (IQ1) | 9.3% | 11.4% |
| Interquartile 75% (IQ3) | 28.5% | 27.5% |
| Interquartile Range (IQR) | 19.2% | 16.1% |
| Standard Deviation (Sample) | 26.7% | 11.7% |
| Standard Deviation (Population) | 25.9% | 11.6% |
Similar Demographics by Child Poverty Among Girls Under 16
Demographics Similar to Immigrants from France by Child Poverty Among Girls Under 16
In terms of child poverty among girls under 16, the demographic groups most similar to Immigrants from France are German (14.9%, a difference of 0.040%), Immigrants from Switzerland (14.9%, a difference of 0.070%), Immigrants from Latvia (14.9%, a difference of 0.090%), Basque (15.0%, a difference of 0.28%), and Immigrants from North America (14.9%, a difference of 0.34%).
| Demographics | Rating | Rank | Child Poverty Among Girls Under 16 |
| Jordanians | 97.1 /100 | #89 | Exceptional 14.8% |
| Northern Europeans | 97.0 /100 | #90 | Exceptional 14.8% |
| Immigrants | Belarus | 97.0 /100 | #91 | Exceptional 14.8% |
| Austrians | 96.7 /100 | #92 | Exceptional 14.9% |
| Immigrants | North America | 96.6 /100 | #93 | Exceptional 14.9% |
| Immigrants | Switzerland | 96.3 /100 | #94 | Exceptional 14.9% |
| Germans | 96.3 /100 | #95 | Exceptional 14.9% |
| Immigrants | France | 96.2 /100 | #96 | Exceptional 14.9% |
| Immigrants | Latvia | 96.1 /100 | #97 | Exceptional 14.9% |
| Basques | 95.9 /100 | #98 | Exceptional 15.0% |
| Immigrants | Egypt | 95.7 /100 | #99 | Exceptional 15.0% |
| Paraguayans | 95.7 /100 | #100 | Exceptional 15.0% |
| Immigrants | South Africa | 95.6 /100 | #101 | Exceptional 15.0% |
| Immigrants | Malaysia | 95.6 /100 | #102 | Exceptional 15.0% |
| British | 95.6 /100 | #103 | Exceptional 15.0% |
Demographics Similar to Immigrants from Lebanon by Child Poverty Among Girls Under 16
In terms of child poverty among girls under 16, the demographic groups most similar to Immigrants from Lebanon are Immigrants from Afghanistan (17.1%, a difference of 0.020%), Immigrants from Uzbekistan (17.1%, a difference of 0.18%), Spaniard (17.0%, a difference of 0.35%), Celtic (17.0%, a difference of 0.41%), and Immigrants from Costa Rica (17.0%, a difference of 0.46%).
| Demographics | Rating | Rank | Child Poverty Among Girls Under 16 |
| Immigrants | Azores | 31.3 /100 | #191 | Fair 16.8% |
| Immigrants | Uganda | 31.3 /100 | #192 | Fair 16.8% |
| Aleuts | 28.7 /100 | #193 | Fair 16.9% |
| Spanish | 28.6 /100 | #194 | Fair 16.9% |
| Immigrants | Costa Rica | 25.6 /100 | #195 | Fair 17.0% |
| Celtics | 25.2 /100 | #196 | Fair 17.0% |
| Spaniards | 24.9 /100 | #197 | Fair 17.0% |
| Immigrants | Lebanon | 22.6 /100 | #198 | Fair 17.1% |
| Immigrants | Afghanistan | 22.4 /100 | #199 | Fair 17.1% |
| Immigrants | Uzbekistan | 21.5 /100 | #200 | Fair 17.1% |
| Immigrants | Kenya | 17.8 /100 | #201 | Poor 17.2% |
| Immigrants | Sierra Leone | 17.6 /100 | #202 | Poor 17.2% |
| Ugandans | 17.5 /100 | #203 | Poor 17.2% |
| Iraqis | 13.0 /100 | #204 | Poor 17.4% |
| Immigrants | Cameroon | 12.6 /100 | #205 | Poor 17.4% |