Immigrants from Armenia vs Immigrants from Lebanon Child Poverty Among Girls Under 16
COMPARE
Immigrants from Armenia
Immigrants from Lebanon
Child Poverty Among Girls Under 16
Child Poverty Among Girls Under 16 Comparison
Immigrants from Armenia
Immigrants from Lebanon
18.1%
CHILD POVERTY AMONG GIRLS UNDER 16
2.9/ 100
METRIC RATING
223rd/ 347
METRIC RANK
17.1%
CHILD POVERTY AMONG GIRLS UNDER 16
22.6/ 100
METRIC RATING
198th/ 347
METRIC RANK
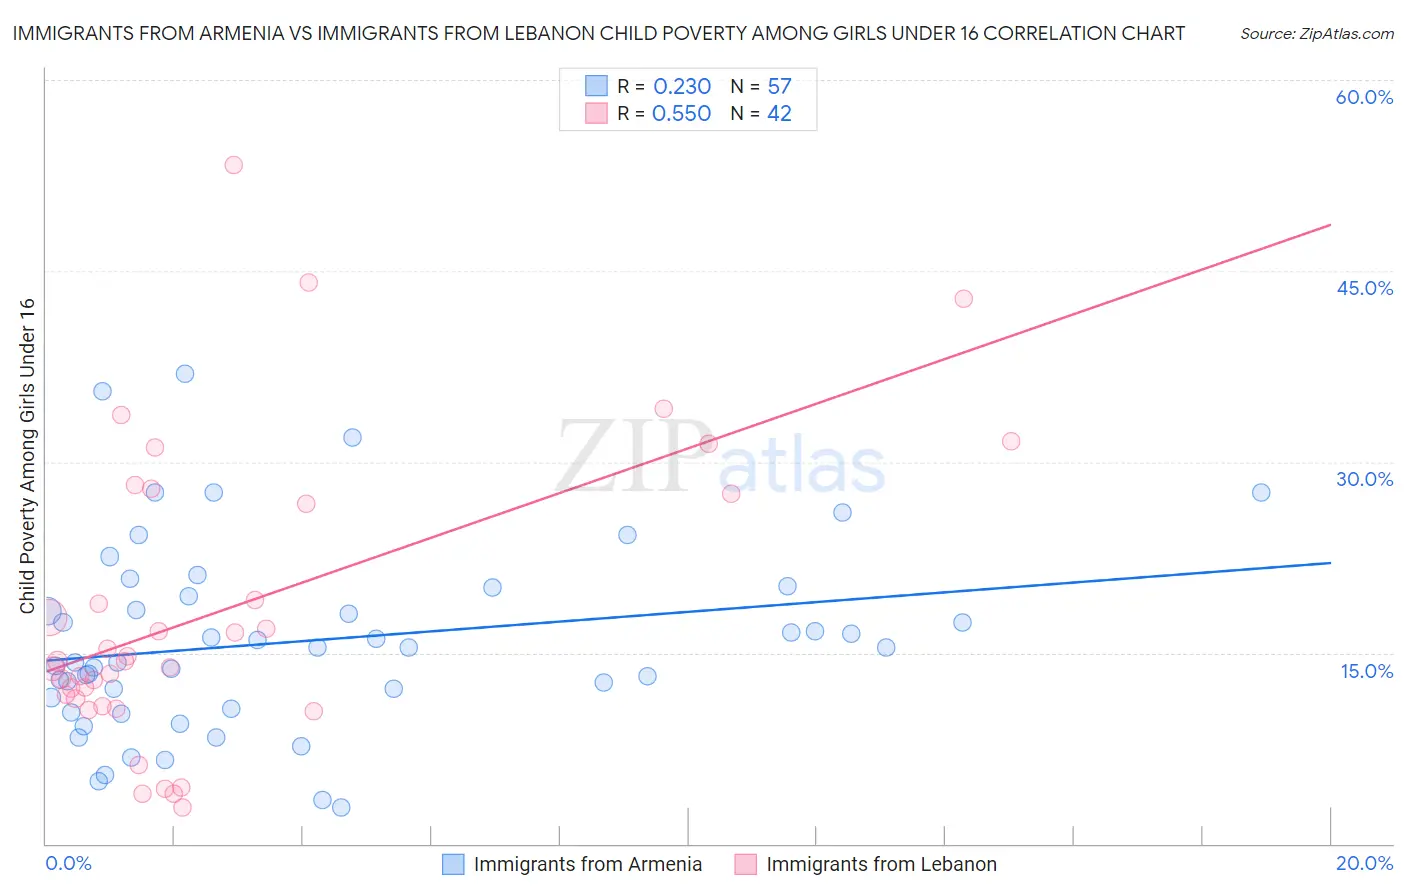
Immigrants from Armenia vs Immigrants from Lebanon Child Poverty Among Girls Under 16 Correlation Chart
The statistical analysis conducted on geographies consisting of 96,961,267 people shows a weak positive correlation between the proportion of Immigrants from Armenia and poverty level among girls under the age of 16 in the United States with a correlation coefficient (R) of 0.230 and weighted average of 18.1%. Similarly, the statistical analysis conducted on geographies consisting of 214,720,358 people shows a substantial positive correlation between the proportion of Immigrants from Lebanon and poverty level among girls under the age of 16 in the United States with a correlation coefficient (R) of 0.550 and weighted average of 17.1%, a difference of 6.3%.
Child Poverty Among Girls Under 16 Correlation Summary
| Measurement | Immigrants from Armenia | Immigrants from Lebanon |
| Minimum | 2.9% | 2.9% |
| Maximum | 36.9% | 53.3% |
| Range | 34.0% | 50.5% |
| Mean | 15.9% | 18.4% |
| Median | 15.4% | 14.3% |
| Interquartile 25% (IQ1) | 11.0% | 11.4% |
| Interquartile 75% (IQ3) | 19.8% | 27.5% |
| Interquartile Range (IQR) | 8.8% | 16.1% |
| Standard Deviation (Sample) | 7.4% | 11.7% |
| Standard Deviation (Population) | 7.4% | 11.6% |
Similar Demographics by Child Poverty Among Girls Under 16
Demographics Similar to Immigrants from Armenia by Child Poverty Among Girls Under 16
In terms of child poverty among girls under 16, the demographic groups most similar to Immigrants from Armenia are Immigrants from Cambodia (18.1%, a difference of 0.0%), Bermudan (18.1%, a difference of 0.070%), Immigrants from Africa (18.2%, a difference of 0.17%), Nicaraguan (18.2%, a difference of 0.50%), and Immigrants from Micronesia (18.0%, a difference of 0.52%).
| Demographics | Rating | Rank | Child Poverty Among Girls Under 16 |
| Moroccans | 5.5 /100 | #216 | Tragic 17.8% |
| Japanese | 5.3 /100 | #217 | Tragic 17.8% |
| Alaska Natives | 5.2 /100 | #218 | Tragic 17.8% |
| Immigrants | Panama | 4.7 /100 | #219 | Tragic 17.9% |
| Cubans | 4.1 /100 | #220 | Tragic 18.0% |
| Immigrants | Micronesia | 3.5 /100 | #221 | Tragic 18.0% |
| Immigrants | Cambodia | 2.9 /100 | #222 | Tragic 18.1% |
| Immigrants | Armenia | 2.9 /100 | #223 | Tragic 18.1% |
| Bermudans | 2.8 /100 | #224 | Tragic 18.1% |
| Immigrants | Africa | 2.7 /100 | #225 | Tragic 18.2% |
| Nicaraguans | 2.4 /100 | #226 | Tragic 18.2% |
| Immigrants | Nonimmigrants | 2.0 /100 | #227 | Tragic 18.3% |
| Alaskan Athabascans | 2.0 /100 | #228 | Tragic 18.3% |
| Ghanaians | 1.4 /100 | #229 | Tragic 18.5% |
| Osage | 1.3 /100 | #230 | Tragic 18.5% |
Demographics Similar to Immigrants from Lebanon by Child Poverty Among Girls Under 16
In terms of child poverty among girls under 16, the demographic groups most similar to Immigrants from Lebanon are Immigrants from Afghanistan (17.1%, a difference of 0.020%), Immigrants from Uzbekistan (17.1%, a difference of 0.18%), Spaniard (17.0%, a difference of 0.35%), Celtic (17.0%, a difference of 0.41%), and Immigrants from Costa Rica (17.0%, a difference of 0.46%).
| Demographics | Rating | Rank | Child Poverty Among Girls Under 16 |
| Immigrants | Azores | 31.3 /100 | #191 | Fair 16.8% |
| Immigrants | Uganda | 31.3 /100 | #192 | Fair 16.8% |
| Aleuts | 28.7 /100 | #193 | Fair 16.9% |
| Spanish | 28.6 /100 | #194 | Fair 16.9% |
| Immigrants | Costa Rica | 25.6 /100 | #195 | Fair 17.0% |
| Celtics | 25.2 /100 | #196 | Fair 17.0% |
| Spaniards | 24.9 /100 | #197 | Fair 17.0% |
| Immigrants | Lebanon | 22.6 /100 | #198 | Fair 17.1% |
| Immigrants | Afghanistan | 22.4 /100 | #199 | Fair 17.1% |
| Immigrants | Uzbekistan | 21.5 /100 | #200 | Fair 17.1% |
| Immigrants | Kenya | 17.8 /100 | #201 | Poor 17.2% |
| Immigrants | Sierra Leone | 17.6 /100 | #202 | Poor 17.2% |
| Ugandans | 17.5 /100 | #203 | Poor 17.2% |
| Iraqis | 13.0 /100 | #204 | Poor 17.4% |
| Immigrants | Cameroon | 12.6 /100 | #205 | Poor 17.4% |