Immigrants from Fiji vs Bulgarian Child Poverty Among Boys Under 16
COMPARE
Immigrants from Fiji
Bulgarian
Child Poverty Among Boys Under 16
Child Poverty Among Boys Under 16 Comparison
Immigrants from Fiji
Bulgarians
15.7%
CHILD POVERTY AMONG BOYS UNDER 16
83.6/ 100
METRIC RATING
143rd/ 347
METRIC RANK
13.3%
CHILD POVERTY AMONG BOYS UNDER 16
99.9/ 100
METRIC RATING
18th/ 347
METRIC RANK
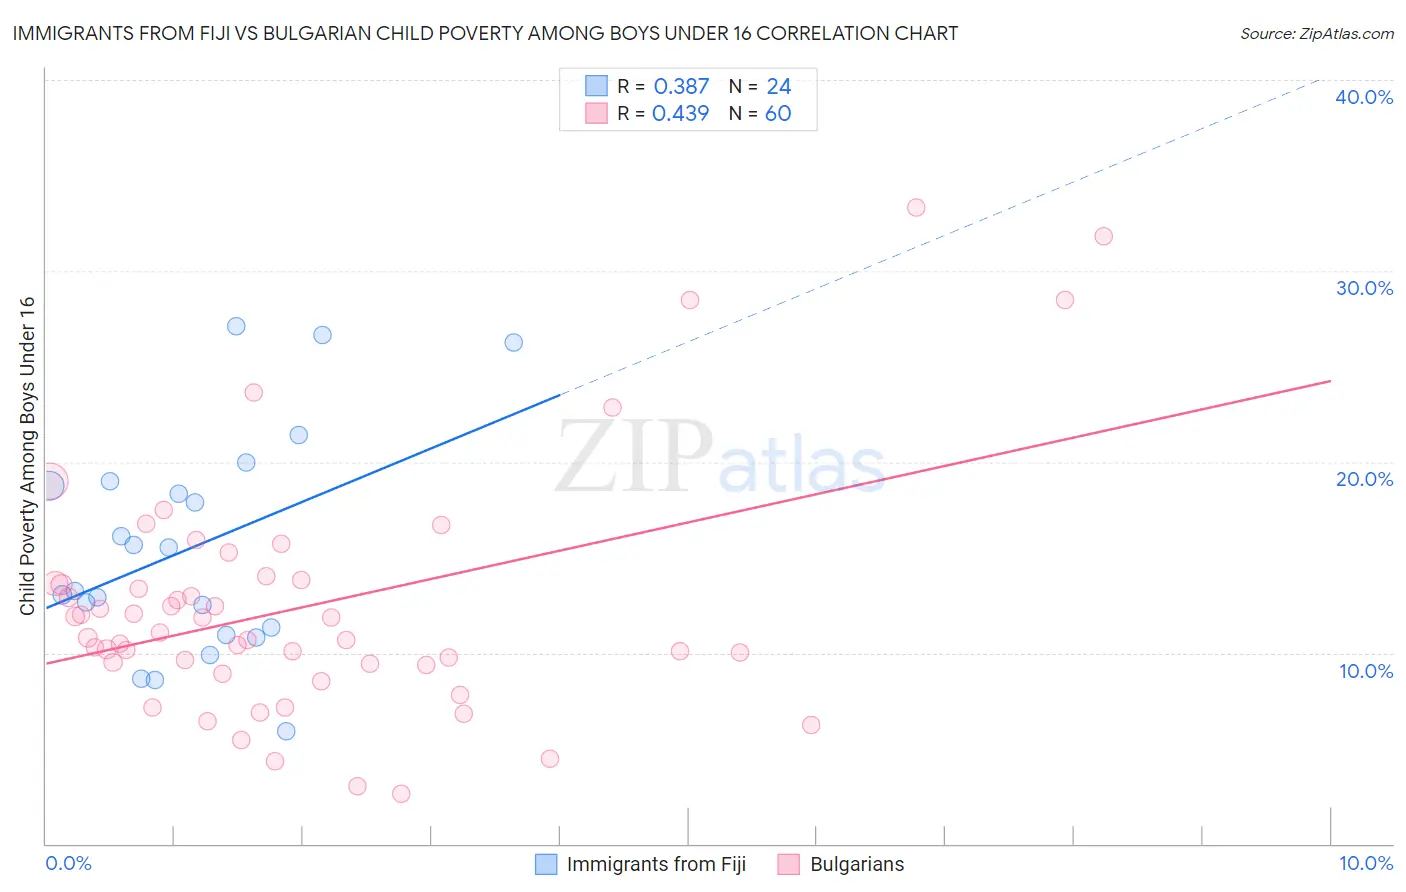
Immigrants from Fiji vs Bulgarian Child Poverty Among Boys Under 16 Correlation Chart
The statistical analysis conducted on geographies consisting of 93,482,281 people shows a mild positive correlation between the proportion of Immigrants from Fiji and poverty level among boys under the age of 16 in the United States with a correlation coefficient (R) of 0.387 and weighted average of 15.7%. Similarly, the statistical analysis conducted on geographies consisting of 203,586,421 people shows a moderate positive correlation between the proportion of Bulgarians and poverty level among boys under the age of 16 in the United States with a correlation coefficient (R) of 0.439 and weighted average of 13.3%, a difference of 18.3%.
Child Poverty Among Boys Under 16 Correlation Summary
| Measurement | Immigrants from Fiji | Bulgarian |
| Minimum | 5.9% | 2.6% |
| Maximum | 27.1% | 33.3% |
| Range | 21.2% | 30.7% |
| Mean | 15.5% | 12.5% |
| Median | 14.4% | 10.9% |
| Interquartile 25% (IQ1) | 11.1% | 9.4% |
| Interquartile 75% (IQ3) | 18.9% | 13.7% |
| Interquartile Range (IQR) | 7.7% | 4.3% |
| Standard Deviation (Sample) | 5.8% | 6.4% |
| Standard Deviation (Population) | 5.7% | 6.3% |
Similar Demographics by Child Poverty Among Boys Under 16
Demographics Similar to Immigrants from Fiji by Child Poverty Among Boys Under 16
In terms of child poverty among boys under 16, the demographic groups most similar to Immigrants from Fiji are Immigrants from Peru (15.7%, a difference of 0.020%), Samoan (15.7%, a difference of 0.080%), Immigrants from Hungary (15.7%, a difference of 0.11%), Slavic (15.7%, a difference of 0.19%), and New Zealander (15.7%, a difference of 0.24%).
| Demographics | Rating | Rank | Child Poverty Among Boys Under 16 |
| Icelanders | 87.5 /100 | #136 | Excellent 15.5% |
| Immigrants | Spain | 87.1 /100 | #137 | Excellent 15.6% |
| Immigrants | Southern Europe | 86.5 /100 | #138 | Excellent 15.6% |
| Albanians | 86.5 /100 | #139 | Excellent 15.6% |
| Immigrants | Kuwait | 85.6 /100 | #140 | Excellent 15.6% |
| Slavs | 84.5 /100 | #141 | Excellent 15.7% |
| Immigrants | Hungary | 84.1 /100 | #142 | Excellent 15.7% |
| Immigrants | Fiji | 83.6 /100 | #143 | Excellent 15.7% |
| Immigrants | Peru | 83.5 /100 | #144 | Excellent 15.7% |
| Samoans | 83.2 /100 | #145 | Excellent 15.7% |
| New Zealanders | 82.4 /100 | #146 | Excellent 15.7% |
| Venezuelans | 82.1 /100 | #147 | Excellent 15.7% |
| Brazilians | 81.0 /100 | #148 | Excellent 15.8% |
| Slovaks | 80.3 /100 | #149 | Excellent 15.8% |
| Immigrants | Jordan | 80.2 /100 | #150 | Excellent 15.8% |
Demographics Similar to Bulgarians by Child Poverty Among Boys Under 16
In terms of child poverty among boys under 16, the demographic groups most similar to Bulgarians are Bolivian (13.3%, a difference of 0.060%), Indian (Asian) (13.3%, a difference of 0.10%), Norwegian (13.2%, a difference of 0.53%), Maltese (13.2%, a difference of 0.62%), and Immigrants from Eastern Asia (13.3%, a difference of 0.70%).
| Demographics | Rating | Rank | Child Poverty Among Boys Under 16 |
| Immigrants | South Central Asia | 100.0 /100 | #11 | Exceptional 12.7% |
| Burmese | 99.9 /100 | #12 | Exceptional 13.0% |
| Immigrants | Korea | 99.9 /100 | #13 | Exceptional 13.0% |
| Immigrants | Ireland | 99.9 /100 | #14 | Exceptional 13.1% |
| Immigrants | Japan | 99.9 /100 | #15 | Exceptional 13.1% |
| Maltese | 99.9 /100 | #16 | Exceptional 13.2% |
| Norwegians | 99.9 /100 | #17 | Exceptional 13.2% |
| Bulgarians | 99.9 /100 | #18 | Exceptional 13.3% |
| Bolivians | 99.9 /100 | #19 | Exceptional 13.3% |
| Indians (Asian) | 99.9 /100 | #20 | Exceptional 13.3% |
| Immigrants | Eastern Asia | 99.9 /100 | #21 | Exceptional 13.3% |
| Tongans | 99.9 /100 | #22 | Exceptional 13.4% |
| Latvians | 99.9 /100 | #23 | Exceptional 13.4% |
| Immigrants | Lithuania | 99.8 /100 | #24 | Exceptional 13.5% |
| Okinawans | 99.8 /100 | #25 | Exceptional 13.5% |