Immigrants from Fiji vs Bulgarian Median Household Income
COMPARE
Immigrants from Fiji
Bulgarian
Median Household Income
Median Household Income Comparison
Immigrants from Fiji
Bulgarians
$93,933
MEDIAN HOUSEHOLD INCOME
99.7/ 100
METRIC RATING
70th/ 347
METRIC RANK
$96,290
MEDIAN HOUSEHOLD INCOME
99.9/ 100
METRIC RATING
50th/ 347
METRIC RANK
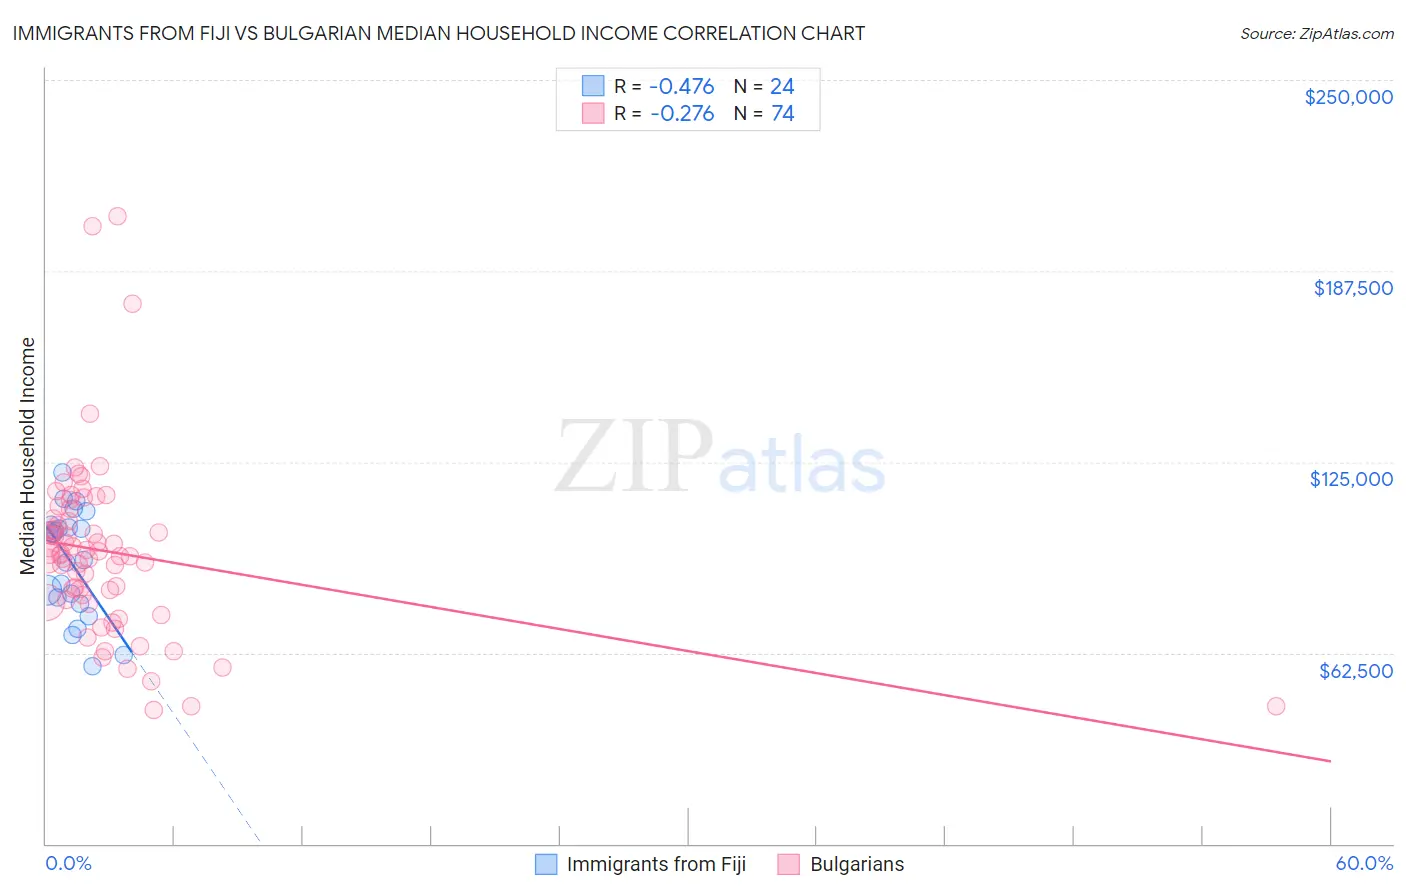
Immigrants from Fiji vs Bulgarian Median Household Income Correlation Chart
The statistical analysis conducted on geographies consisting of 93,754,169 people shows a moderate negative correlation between the proportion of Immigrants from Fiji and median household income in the United States with a correlation coefficient (R) of -0.476 and weighted average of $93,933. Similarly, the statistical analysis conducted on geographies consisting of 205,543,372 people shows a weak negative correlation between the proportion of Bulgarians and median household income in the United States with a correlation coefficient (R) of -0.276 and weighted average of $96,290, a difference of 2.5%.
Median Household Income Correlation Summary
| Measurement | Immigrants from Fiji | Bulgarian |
| Minimum | $58,122 | $43,716 |
| Maximum | $121,408 | $205,412 |
| Range | $63,286 | $161,696 |
| Mean | $92,206 | $95,604 |
| Median | $97,285 | $94,643 |
| Interquartile 25% (IQ1) | $79,580 | $79,613 |
| Interquartile 75% (IQ3) | $103,956 | $106,436 |
| Interquartile Range (IQR) | $24,377 | $26,823 |
| Standard Deviation (Sample) | $17,579 | $28,917 |
| Standard Deviation (Population) | $17,209 | $28,721 |
Demographics Similar to Immigrants from Fiji and Bulgarians by Median Household Income
In terms of median household income, the demographic groups most similar to Immigrants from Fiji are Argentinean ($93,960, a difference of 0.030%), Mongolian ($93,971, a difference of 0.040%), Immigrants from Scotland ($94,091, a difference of 0.17%), Immigrants from Romania ($94,222, a difference of 0.31%), and Immigrants from Belarus ($94,399, a difference of 0.50%). Similarly, the demographic groups most similar to Bulgarians are Estonian ($95,930, a difference of 0.38%), Immigrants from South Africa ($95,800, a difference of 0.51%), Paraguayan ($95,737, a difference of 0.58%), Egyptian ($95,673, a difference of 0.64%), and Immigrants from Czechoslovakia ($95,319, a difference of 1.0%).
| Demographics | Rating | Rank | Median Household Income |
| Bulgarians | 99.9 /100 | #50 | Exceptional $96,290 |
| Estonians | 99.9 /100 | #51 | Exceptional $95,930 |
| Immigrants | South Africa | 99.9 /100 | #52 | Exceptional $95,800 |
| Paraguayans | 99.9 /100 | #53 | Exceptional $95,737 |
| Egyptians | 99.9 /100 | #54 | Exceptional $95,673 |
| Immigrants | Czechoslovakia | 99.9 /100 | #55 | Exceptional $95,319 |
| Immigrants | Austria | 99.9 /100 | #56 | Exceptional $95,277 |
| New Zealanders | 99.8 /100 | #57 | Exceptional $95,146 |
| Soviet Union | 99.8 /100 | #58 | Exceptional $95,098 |
| Immigrants | Europe | 99.8 /100 | #59 | Exceptional $95,032 |
| Koreans | 99.8 /100 | #60 | Exceptional $95,018 |
| Laotians | 99.8 /100 | #61 | Exceptional $94,990 |
| Immigrants | Norway | 99.8 /100 | #62 | Exceptional $94,846 |
| Greeks | 99.8 /100 | #63 | Exceptional $94,735 |
| Immigrants | Netherlands | 99.7 /100 | #64 | Exceptional $94,411 |
| Immigrants | Belarus | 99.7 /100 | #65 | Exceptional $94,399 |
| Immigrants | Romania | 99.7 /100 | #66 | Exceptional $94,222 |
| Immigrants | Scotland | 99.7 /100 | #67 | Exceptional $94,091 |
| Mongolians | 99.7 /100 | #68 | Exceptional $93,971 |
| Argentineans | 99.7 /100 | #69 | Exceptional $93,960 |
| Immigrants | Fiji | 99.7 /100 | #70 | Exceptional $93,933 |