Finnish vs Bulgarian Child Poverty Among Boys Under 16
COMPARE
Finnish
Bulgarian
Child Poverty Among Boys Under 16
Child Poverty Among Boys Under 16 Comparison
Finns
Bulgarians
14.9%
CHILD POVERTY AMONG BOYS UNDER 16
96.5/ 100
METRIC RATING
95th/ 347
METRIC RANK
13.3%
CHILD POVERTY AMONG BOYS UNDER 16
99.9/ 100
METRIC RATING
18th/ 347
METRIC RANK
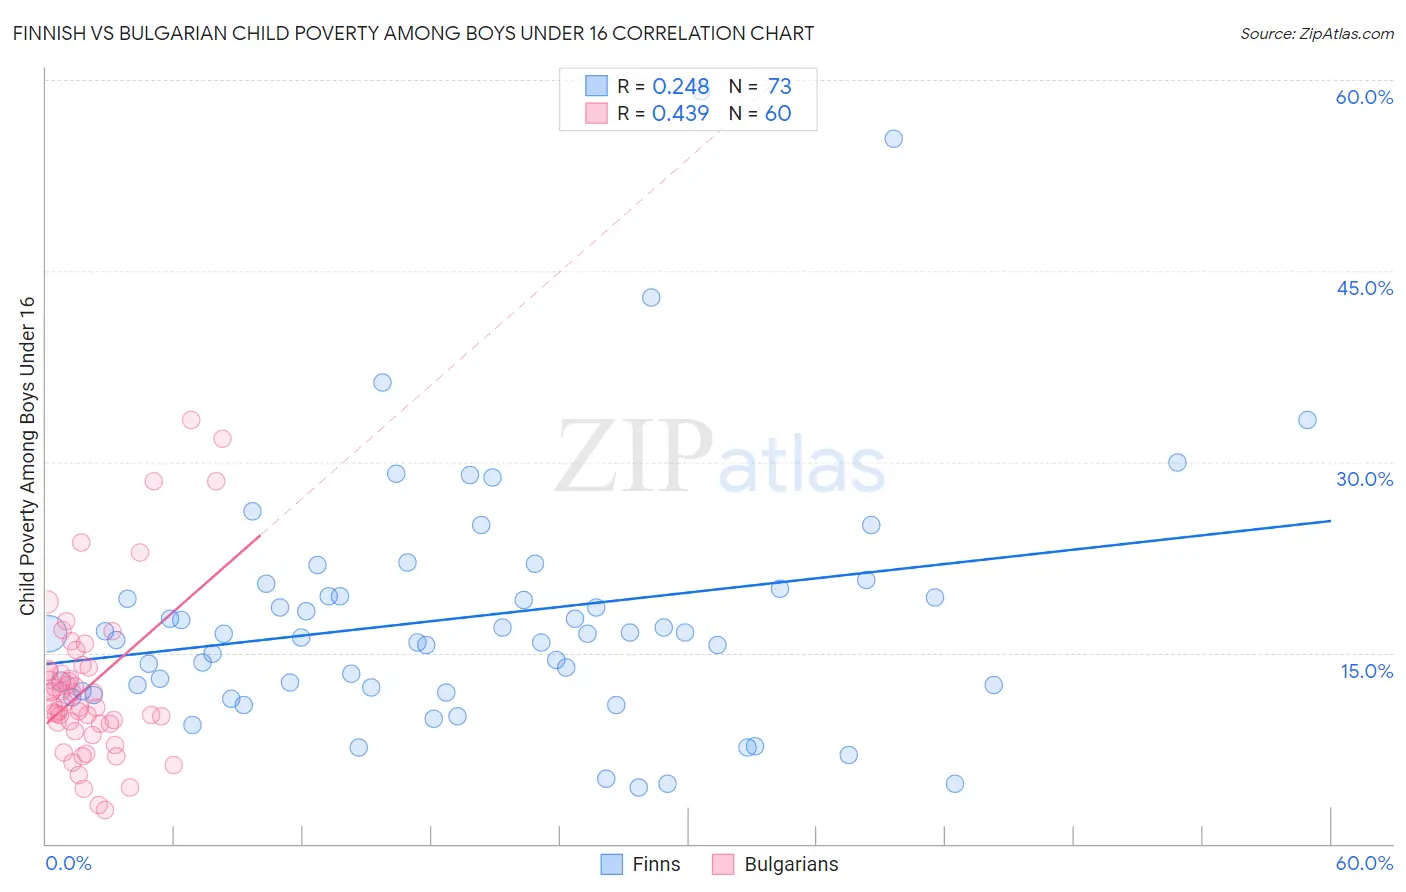
Finnish vs Bulgarian Child Poverty Among Boys Under 16 Correlation Chart
The statistical analysis conducted on geographies consisting of 396,043,937 people shows a weak positive correlation between the proportion of Finns and poverty level among boys under the age of 16 in the United States with a correlation coefficient (R) of 0.248 and weighted average of 14.9%. Similarly, the statistical analysis conducted on geographies consisting of 203,586,421 people shows a moderate positive correlation between the proportion of Bulgarians and poverty level among boys under the age of 16 in the United States with a correlation coefficient (R) of 0.439 and weighted average of 13.3%, a difference of 12.5%.
Child Poverty Among Boys Under 16 Correlation Summary
| Measurement | Finnish | Bulgarian |
| Minimum | 4.4% | 2.6% |
| Maximum | 59.2% | 33.3% |
| Range | 54.8% | 30.7% |
| Mean | 17.8% | 12.5% |
| Median | 16.5% | 10.9% |
| Interquartile 25% (IQ1) | 12.1% | 9.4% |
| Interquartile 75% (IQ3) | 19.7% | 13.7% |
| Interquartile Range (IQR) | 7.6% | 4.3% |
| Standard Deviation (Sample) | 9.9% | 6.4% |
| Standard Deviation (Population) | 9.8% | 6.3% |
Similar Demographics by Child Poverty Among Boys Under 16
Demographics Similar to Finns by Child Poverty Among Boys Under 16
In terms of child poverty among boys under 16, the demographic groups most similar to Finns are Immigrants from Italy (14.9%, a difference of 0.10%), Sri Lankan (14.9%, a difference of 0.11%), Argentinean (14.9%, a difference of 0.16%), Paraguayan (14.9%, a difference of 0.23%), and Immigrants from North Macedonia (14.9%, a difference of 0.25%).
| Demographics | Rating | Rank | Child Poverty Among Boys Under 16 |
| Immigrants | North America | 97.1 /100 | #88 | Exceptional 14.8% |
| Immigrants | Argentina | 97.1 /100 | #89 | Exceptional 14.8% |
| Austrians | 97.1 /100 | #90 | Exceptional 14.8% |
| Paraguayans | 96.8 /100 | #91 | Exceptional 14.9% |
| Argentineans | 96.7 /100 | #92 | Exceptional 14.9% |
| Sri Lankans | 96.7 /100 | #93 | Exceptional 14.9% |
| Immigrants | Italy | 96.7 /100 | #94 | Exceptional 14.9% |
| Finns | 96.5 /100 | #95 | Exceptional 14.9% |
| Immigrants | North Macedonia | 96.3 /100 | #96 | Exceptional 14.9% |
| Immigrants | Egypt | 96.2 /100 | #97 | Exceptional 14.9% |
| British | 96.2 /100 | #98 | Exceptional 15.0% |
| Immigrants | France | 96.1 /100 | #99 | Exceptional 15.0% |
| Chileans | 95.8 /100 | #100 | Exceptional 15.0% |
| Immigrants | Belarus | 95.7 /100 | #101 | Exceptional 15.0% |
| Romanians | 95.6 /100 | #102 | Exceptional 15.0% |
Demographics Similar to Bulgarians by Child Poverty Among Boys Under 16
In terms of child poverty among boys under 16, the demographic groups most similar to Bulgarians are Bolivian (13.3%, a difference of 0.060%), Indian (Asian) (13.3%, a difference of 0.10%), Norwegian (13.2%, a difference of 0.53%), Maltese (13.2%, a difference of 0.62%), and Immigrants from Eastern Asia (13.3%, a difference of 0.70%).
| Demographics | Rating | Rank | Child Poverty Among Boys Under 16 |
| Immigrants | South Central Asia | 100.0 /100 | #11 | Exceptional 12.7% |
| Burmese | 99.9 /100 | #12 | Exceptional 13.0% |
| Immigrants | Korea | 99.9 /100 | #13 | Exceptional 13.0% |
| Immigrants | Ireland | 99.9 /100 | #14 | Exceptional 13.1% |
| Immigrants | Japan | 99.9 /100 | #15 | Exceptional 13.1% |
| Maltese | 99.9 /100 | #16 | Exceptional 13.2% |
| Norwegians | 99.9 /100 | #17 | Exceptional 13.2% |
| Bulgarians | 99.9 /100 | #18 | Exceptional 13.3% |
| Bolivians | 99.9 /100 | #19 | Exceptional 13.3% |
| Indians (Asian) | 99.9 /100 | #20 | Exceptional 13.3% |
| Immigrants | Eastern Asia | 99.9 /100 | #21 | Exceptional 13.3% |
| Tongans | 99.9 /100 | #22 | Exceptional 13.4% |
| Latvians | 99.9 /100 | #23 | Exceptional 13.4% |
| Immigrants | Lithuania | 99.8 /100 | #24 | Exceptional 13.5% |
| Okinawans | 99.8 /100 | #25 | Exceptional 13.5% |