Immigrants from Europe vs Greek Female Poverty Among 18-24 Year Olds
COMPARE
Immigrants from Europe
Greek
Female Poverty Among 18-24 Year Olds
Female Poverty Among 18-24 Year Olds Comparison
Immigrants from Europe
Greeks
18.8%
FEMALE POVERTY AMONG 18-24 YEAR OLDS
99.5/ 100
METRIC RATING
78th/ 347
METRIC RANK
18.5%
FEMALE POVERTY AMONG 18-24 YEAR OLDS
99.8/ 100
METRIC RATING
62nd/ 347
METRIC RANK
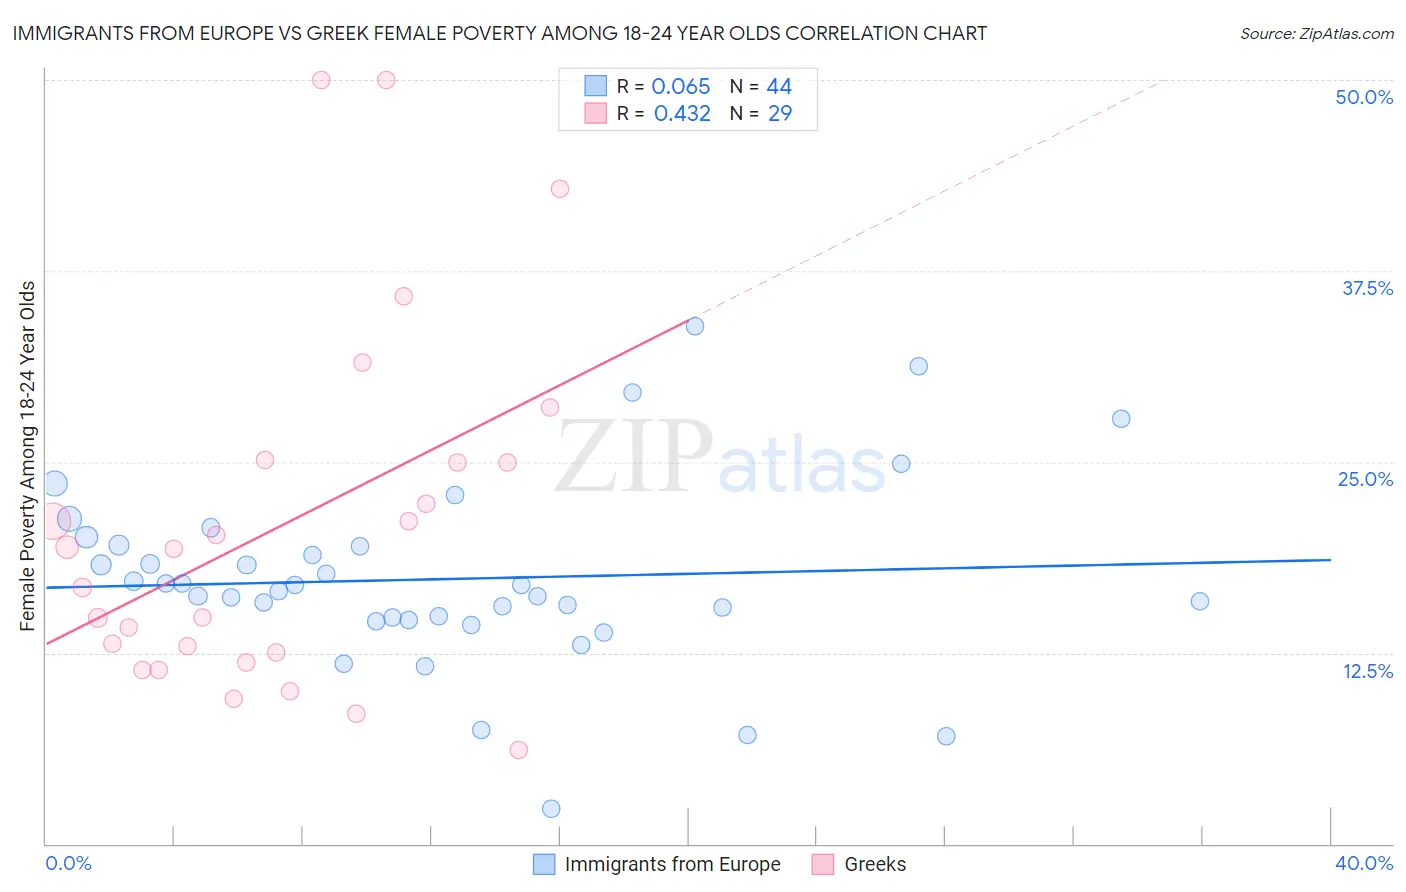
Immigrants from Europe vs Greek Female Poverty Among 18-24 Year Olds Correlation Chart
The statistical analysis conducted on geographies consisting of 519,189,287 people shows a slight positive correlation between the proportion of Immigrants from Europe and poverty level among females between the ages 18 and 24 in the United States with a correlation coefficient (R) of 0.065 and weighted average of 18.8%. Similarly, the statistical analysis conducted on geographies consisting of 463,009,095 people shows a moderate positive correlation between the proportion of Greeks and poverty level among females between the ages 18 and 24 in the United States with a correlation coefficient (R) of 0.432 and weighted average of 18.5%, a difference of 1.4%.
Female Poverty Among 18-24 Year Olds Correlation Summary
| Measurement | Immigrants from Europe | Greek |
| Minimum | 2.3% | 6.1% |
| Maximum | 33.9% | 50.0% |
| Range | 31.6% | 43.9% |
| Mean | 17.3% | 20.9% |
| Median | 16.8% | 19.3% |
| Interquartile 25% (IQ1) | 14.7% | 12.2% |
| Interquartile 75% (IQ3) | 19.5% | 25.1% |
| Interquartile Range (IQR) | 4.8% | 12.9% |
| Standard Deviation (Sample) | 6.1% | 11.7% |
| Standard Deviation (Population) | 6.0% | 11.5% |
Demographics Similar to Immigrants from Europe and Greeks by Female Poverty Among 18-24 Year Olds
In terms of female poverty among 18-24 year olds, the demographic groups most similar to Immigrants from Europe are Uruguayan (18.8%, a difference of 0.0%), Costa Rican (18.8%, a difference of 0.010%), Palestinian (18.8%, a difference of 0.080%), Immigrants from Cambodia (18.8%, a difference of 0.11%), and Polish (18.8%, a difference of 0.19%). Similarly, the demographic groups most similar to Greeks are Immigrants from Belarus (18.5%, a difference of 0.010%), Immigrants from Asia (18.6%, a difference of 0.040%), Immigrants from Albania (18.5%, a difference of 0.070%), Immigrants from Scotland (18.6%, a difference of 0.070%), and Immigrants from Brazil (18.5%, a difference of 0.12%).
| Demographics | Rating | Rank | Female Poverty Among 18-24 Year Olds |
| Immigrants | Brazil | 99.8 /100 | #60 | Exceptional 18.5% |
| Immigrants | Albania | 99.8 /100 | #61 | Exceptional 18.5% |
| Greeks | 99.8 /100 | #62 | Exceptional 18.5% |
| Immigrants | Belarus | 99.8 /100 | #63 | Exceptional 18.5% |
| Immigrants | Asia | 99.8 /100 | #64 | Exceptional 18.6% |
| Immigrants | Scotland | 99.8 /100 | #65 | Exceptional 18.6% |
| Jordanians | 99.8 /100 | #66 | Exceptional 18.6% |
| Immigrants | Korea | 99.8 /100 | #67 | Exceptional 18.6% |
| Brazilians | 99.8 /100 | #68 | Exceptional 18.6% |
| Immigrants | Bulgaria | 99.7 /100 | #69 | Exceptional 18.6% |
| Immigrants | Costa Rica | 99.7 /100 | #70 | Exceptional 18.7% |
| Immigrants | Haiti | 99.7 /100 | #71 | Exceptional 18.7% |
| Armenians | 99.7 /100 | #72 | Exceptional 18.7% |
| Lithuanians | 99.7 /100 | #73 | Exceptional 18.7% |
| Hawaiians | 99.6 /100 | #74 | Exceptional 18.7% |
| Poles | 99.6 /100 | #75 | Exceptional 18.8% |
| Immigrants | Cambodia | 99.5 /100 | #76 | Exceptional 18.8% |
| Costa Ricans | 99.5 /100 | #77 | Exceptional 18.8% |
| Immigrants | Europe | 99.5 /100 | #78 | Exceptional 18.8% |
| Uruguayans | 99.5 /100 | #79 | Exceptional 18.8% |
| Palestinians | 99.5 /100 | #80 | Exceptional 18.8% |