Immigrants from Europe vs Immigrants from Central America Single Mother Poverty
COMPARE
Immigrants from Europe
Immigrants from Central America
Single Mother Poverty
Single Mother Poverty Comparison
Immigrants from Europe
Immigrants from Central America
27.4%
SINGLE MOTHER POVERTY
99.3/ 100
METRIC RATING
74th/ 347
METRIC RANK
33.6%
SINGLE MOTHER POVERTY
0.0/ 100
METRIC RATING
305th/ 347
METRIC RANK
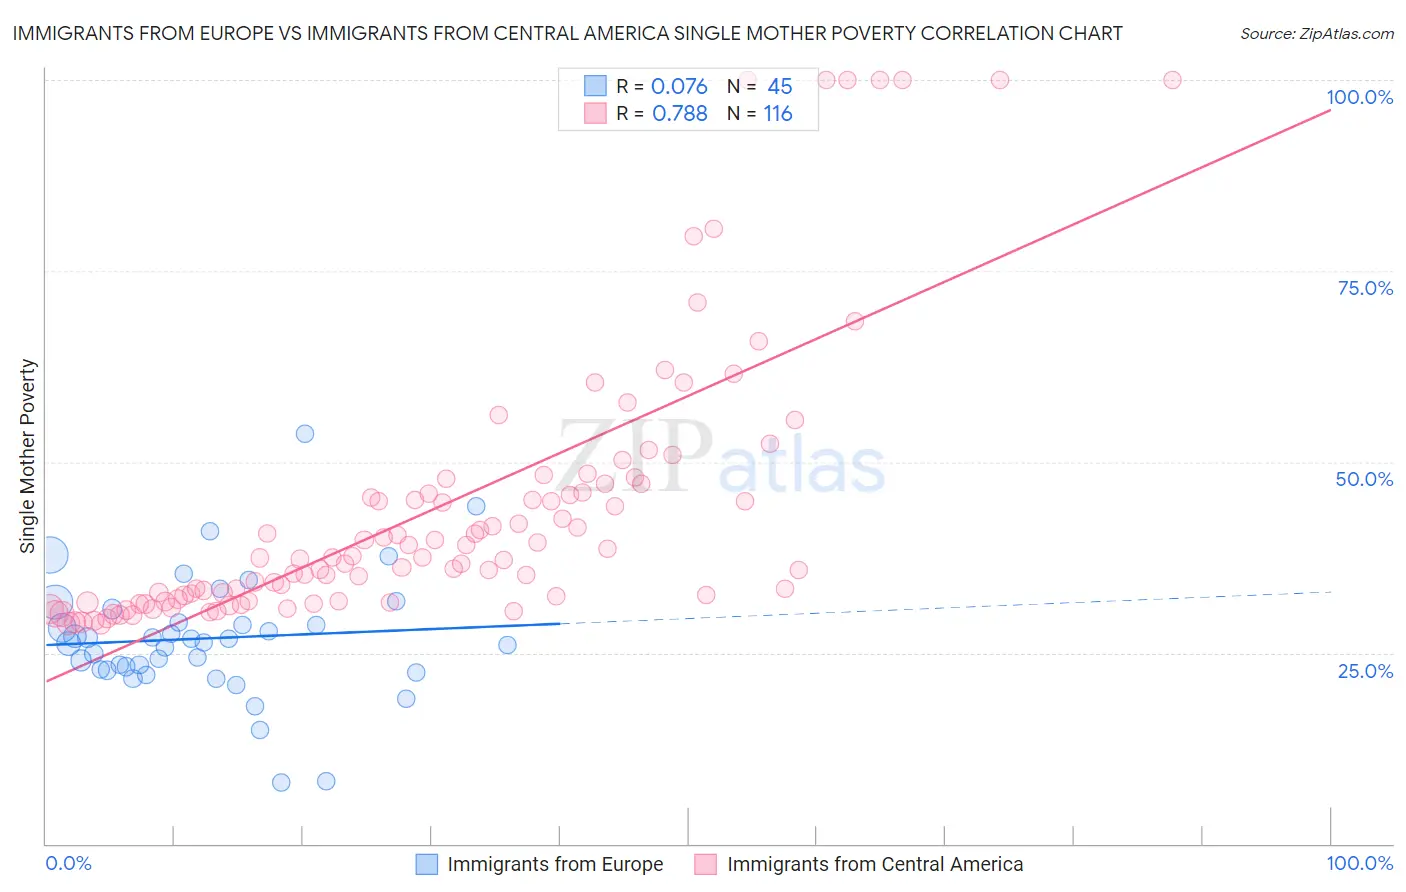
Immigrants from Europe vs Immigrants from Central America Single Mother Poverty Correlation Chart
The statistical analysis conducted on geographies consisting of 523,370,699 people shows a slight positive correlation between the proportion of Immigrants from Europe and poverty level among single mothers in the United States with a correlation coefficient (R) of 0.076 and weighted average of 27.4%. Similarly, the statistical analysis conducted on geographies consisting of 516,841,574 people shows a strong positive correlation between the proportion of Immigrants from Central America and poverty level among single mothers in the United States with a correlation coefficient (R) of 0.788 and weighted average of 33.6%, a difference of 22.3%.
Single Mother Poverty Correlation Summary
| Measurement | Immigrants from Europe | Immigrants from Central America |
| Minimum | 8.0% | 28.8% |
| Maximum | 53.7% | 100.0% |
| Range | 45.6% | 71.2% |
| Mean | 26.9% | 43.8% |
| Median | 26.4% | 37.4% |
| Interquartile 25% (IQ1) | 22.8% | 31.9% |
| Interquartile 75% (IQ3) | 29.9% | 46.6% |
| Interquartile Range (IQR) | 7.1% | 14.7% |
| Standard Deviation (Sample) | 8.2% | 17.8% |
| Standard Deviation (Population) | 8.1% | 17.8% |
Similar Demographics by Single Mother Poverty
Demographics Similar to Immigrants from Europe by Single Mother Poverty
In terms of single mother poverty, the demographic groups most similar to Immigrants from Europe are Sierra Leonean (27.4%, a difference of 0.060%), Immigrants from Russia (27.4%, a difference of 0.13%), Immigrants from Sweden (27.5%, a difference of 0.13%), Macedonian (27.4%, a difference of 0.15%), and Immigrants from Belarus (27.4%, a difference of 0.17%).
| Demographics | Rating | Rank | Single Mother Poverty |
| Immigrants | Australia | 99.5 /100 | #67 | Exceptional 27.3% |
| Immigrants | Czechoslovakia | 99.5 /100 | #68 | Exceptional 27.4% |
| Lithuanians | 99.4 /100 | #69 | Exceptional 27.4% |
| Immigrants | Belarus | 99.4 /100 | #70 | Exceptional 27.4% |
| Macedonians | 99.4 /100 | #71 | Exceptional 27.4% |
| Immigrants | Russia | 99.4 /100 | #72 | Exceptional 27.4% |
| Sierra Leoneans | 99.3 /100 | #73 | Exceptional 27.4% |
| Immigrants | Europe | 99.3 /100 | #74 | Exceptional 27.4% |
| Immigrants | Sweden | 99.2 /100 | #75 | Exceptional 27.5% |
| Peruvians | 99.2 /100 | #76 | Exceptional 27.5% |
| Immigrants | Peru | 99.2 /100 | #77 | Exceptional 27.5% |
| Immigrants | North Macedonia | 99.2 /100 | #78 | Exceptional 27.5% |
| Immigrants | Italy | 99.1 /100 | #79 | Exceptional 27.5% |
| Taiwanese | 99.1 /100 | #80 | Exceptional 27.5% |
| Immigrants | Scotland | 98.9 /100 | #81 | Exceptional 27.6% |
Demographics Similar to Immigrants from Central America by Single Mother Poverty
In terms of single mother poverty, the demographic groups most similar to Immigrants from Central America are Mexican (33.6%, a difference of 0.040%), American (33.5%, a difference of 0.15%), Arapaho (33.4%, a difference of 0.41%), Immigrants from Somalia (33.4%, a difference of 0.55%), and Immigrants from Congo (33.8%, a difference of 0.64%).
| Demographics | Rating | Rank | Single Mother Poverty |
| Africans | 0.0 /100 | #298 | Tragic 33.3% |
| Immigrants | Guatemala | 0.0 /100 | #299 | Tragic 33.3% |
| Hispanics or Latinos | 0.0 /100 | #300 | Tragic 33.3% |
| Immigrants | Somalia | 0.0 /100 | #301 | Tragic 33.4% |
| Arapaho | 0.0 /100 | #302 | Tragic 33.4% |
| Americans | 0.0 /100 | #303 | Tragic 33.5% |
| Mexicans | 0.0 /100 | #304 | Tragic 33.6% |
| Immigrants | Central America | 0.0 /100 | #305 | Tragic 33.6% |
| Immigrants | Congo | 0.0 /100 | #306 | Tragic 33.8% |
| Comanche | 0.0 /100 | #307 | Tragic 33.9% |
| Immigrants | Mexico | 0.0 /100 | #308 | Tragic 34.0% |
| Potawatomi | 0.0 /100 | #309 | Tragic 34.1% |
| Hondurans | 0.0 /100 | #310 | Tragic 34.2% |
| Alsatians | 0.0 /100 | #311 | Tragic 34.3% |
| Central American Indians | 0.0 /100 | #312 | Tragic 34.3% |