Immigrants from Europe vs Ecuadorian Seniors Poverty Over the Age of 75
COMPARE
Immigrants from Europe
Ecuadorian
Seniors Poverty Over the Age of 75
Seniors Poverty Over the Age of 75 Comparison
Immigrants from Europe
Ecuadorians
12.2%
SENIORS POVERTY OVER THE AGE OF 75
50.0/ 100
METRIC RATING
174th/ 347
METRIC RANK
15.7%
SENIORS POVERTY OVER THE AGE OF 75
0.0/ 100
METRIC RATING
305th/ 347
METRIC RANK
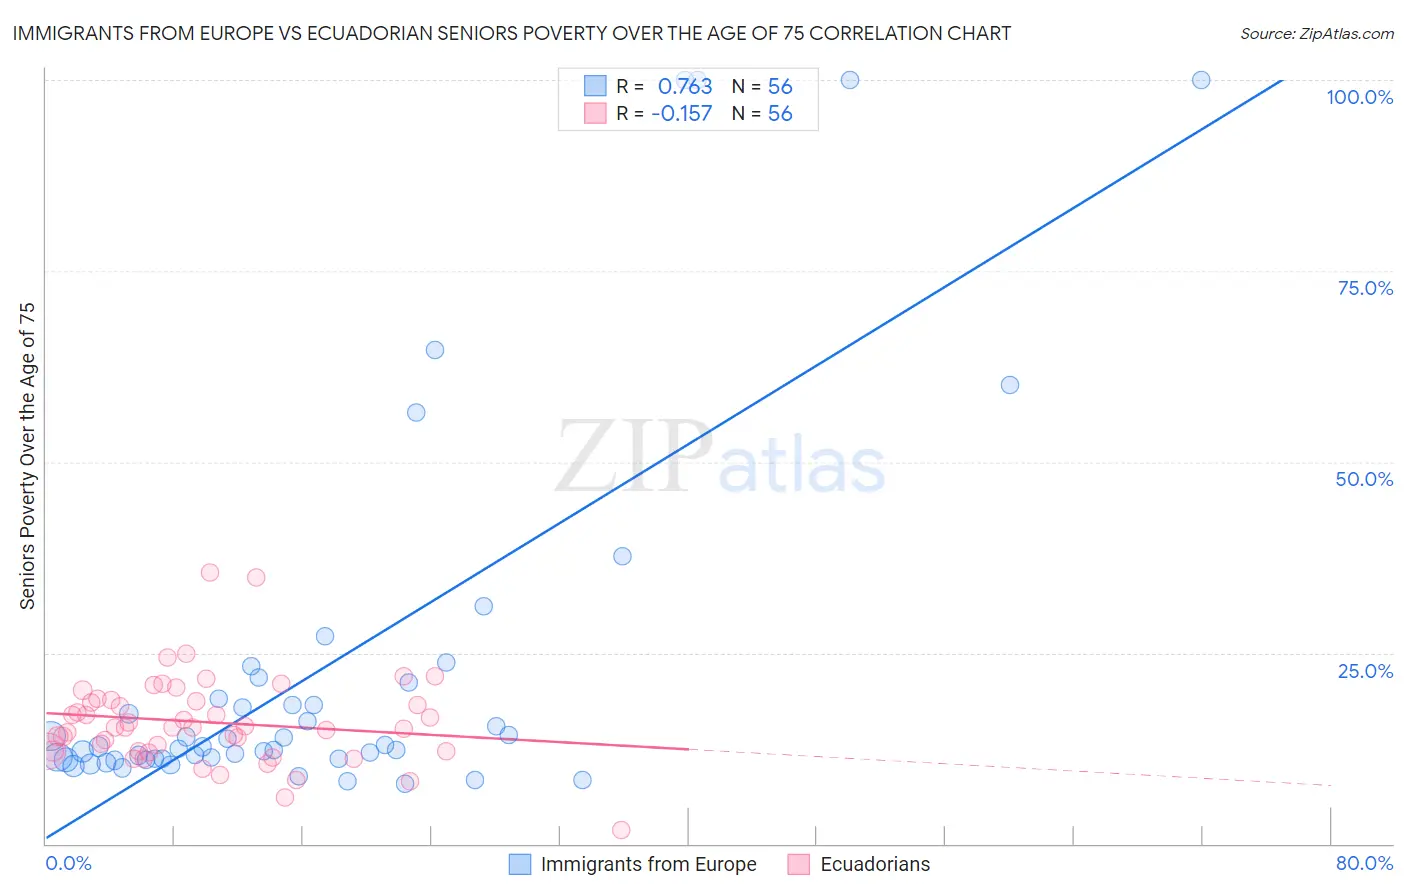
Immigrants from Europe vs Ecuadorian Seniors Poverty Over the Age of 75 Correlation Chart
The statistical analysis conducted on geographies consisting of 534,137,769 people shows a strong positive correlation between the proportion of Immigrants from Europe and poverty level among seniors over the age of 75 in the United States with a correlation coefficient (R) of 0.763 and weighted average of 12.2%. Similarly, the statistical analysis conducted on geographies consisting of 314,971,208 people shows a poor negative correlation between the proportion of Ecuadorians and poverty level among seniors over the age of 75 in the United States with a correlation coefficient (R) of -0.157 and weighted average of 15.7%, a difference of 29.2%.
Seniors Poverty Over the Age of 75 Correlation Summary
| Measurement | Immigrants from Europe | Ecuadorian |
| Minimum | 7.9% | 1.9% |
| Maximum | 100.0% | 35.5% |
| Range | 92.1% | 33.7% |
| Mean | 23.0% | 15.9% |
| Median | 12.7% | 15.2% |
| Interquartile 25% (IQ1) | 11.1% | 12.1% |
| Interquartile 75% (IQ3) | 20.0% | 18.7% |
| Interquartile Range (IQR) | 8.9% | 6.6% |
| Standard Deviation (Sample) | 24.6% | 5.9% |
| Standard Deviation (Population) | 24.4% | 5.8% |
Similar Demographics by Seniors Poverty Over the Age of 75
Demographics Similar to Immigrants from Europe by Seniors Poverty Over the Age of 75
In terms of seniors poverty over the age of 75, the demographic groups most similar to Immigrants from Europe are Arab (12.2%, a difference of 0.040%), Immigrants from Saudi Arabia (12.2%, a difference of 0.040%), Immigrants from Fiji (12.2%, a difference of 0.12%), Spaniard (12.2%, a difference of 0.13%), and Immigrants from Thailand (12.2%, a difference of 0.16%).
| Demographics | Rating | Rank | Seniors Poverty Over the Age of 75 |
| Immigrants | Switzerland | 54.5 /100 | #167 | Average 12.1% |
| Immigrants | Syria | 53.9 /100 | #168 | Average 12.2% |
| Immigrants | Egypt | 53.7 /100 | #169 | Average 12.2% |
| Immigrants | Thailand | 52.0 /100 | #170 | Average 12.2% |
| Spaniards | 51.6 /100 | #171 | Average 12.2% |
| Immigrants | Fiji | 51.5 /100 | #172 | Average 12.2% |
| Arabs | 50.5 /100 | #173 | Average 12.2% |
| Immigrants | Europe | 50.0 /100 | #174 | Average 12.2% |
| Immigrants | Saudi Arabia | 49.5 /100 | #175 | Average 12.2% |
| Immigrants | Iran | 48.1 /100 | #176 | Average 12.2% |
| Immigrants | Asia | 47.8 /100 | #177 | Average 12.2% |
| Immigrants | Nonimmigrants | 46.8 /100 | #178 | Average 12.2% |
| Mongolians | 45.5 /100 | #179 | Average 12.2% |
| Immigrants | South Eastern Asia | 44.3 /100 | #180 | Average 12.2% |
| Immigrants | Australia | 44.2 /100 | #181 | Average 12.2% |
Demographics Similar to Ecuadorians by Seniors Poverty Over the Age of 75
In terms of seniors poverty over the age of 75, the demographic groups most similar to Ecuadorians are Immigrants from Trinidad and Tobago (15.7%, a difference of 0.040%), Hispanic or Latino (15.8%, a difference of 0.16%), Immigrants from Honduras (15.7%, a difference of 0.22%), Immigrants from West Indies (15.8%, a difference of 0.30%), and Immigrants from Bangladesh (15.8%, a difference of 0.34%).
| Demographics | Rating | Rank | Seniors Poverty Over the Age of 75 |
| Natives/Alaskans | 0.0 /100 | #298 | Tragic 15.5% |
| Spanish American Indians | 0.0 /100 | #299 | Tragic 15.5% |
| Bahamians | 0.0 /100 | #300 | Tragic 15.5% |
| Immigrants | Latin America | 0.0 /100 | #301 | Tragic 15.6% |
| West Indians | 0.0 /100 | #302 | Tragic 15.7% |
| Immigrants | Honduras | 0.0 /100 | #303 | Tragic 15.7% |
| Immigrants | Trinidad and Tobago | 0.0 /100 | #304 | Tragic 15.7% |
| Ecuadorians | 0.0 /100 | #305 | Tragic 15.7% |
| Hispanics or Latinos | 0.0 /100 | #306 | Tragic 15.8% |
| Immigrants | West Indies | 0.0 /100 | #307 | Tragic 15.8% |
| Immigrants | Bangladesh | 0.0 /100 | #308 | Tragic 15.8% |
| Yup'ik | 0.0 /100 | #309 | Tragic 15.8% |
| Vietnamese | 0.0 /100 | #310 | Tragic 15.9% |
| Trinidadians and Tobagonians | 0.0 /100 | #311 | Tragic 15.9% |
| Crow | 0.0 /100 | #312 | Tragic 15.9% |