Afghan vs Ecuadorian Seniors Poverty Over the Age of 75
COMPARE
Afghan
Ecuadorian
Seniors Poverty Over the Age of 75
Seniors Poverty Over the Age of 75 Comparison
Afghans
Ecuadorians
11.2%
SENIORS POVERTY OVER THE AGE OF 75
98.2/ 100
METRIC RATING
54th/ 347
METRIC RANK
15.7%
SENIORS POVERTY OVER THE AGE OF 75
0.0/ 100
METRIC RATING
305th/ 347
METRIC RANK
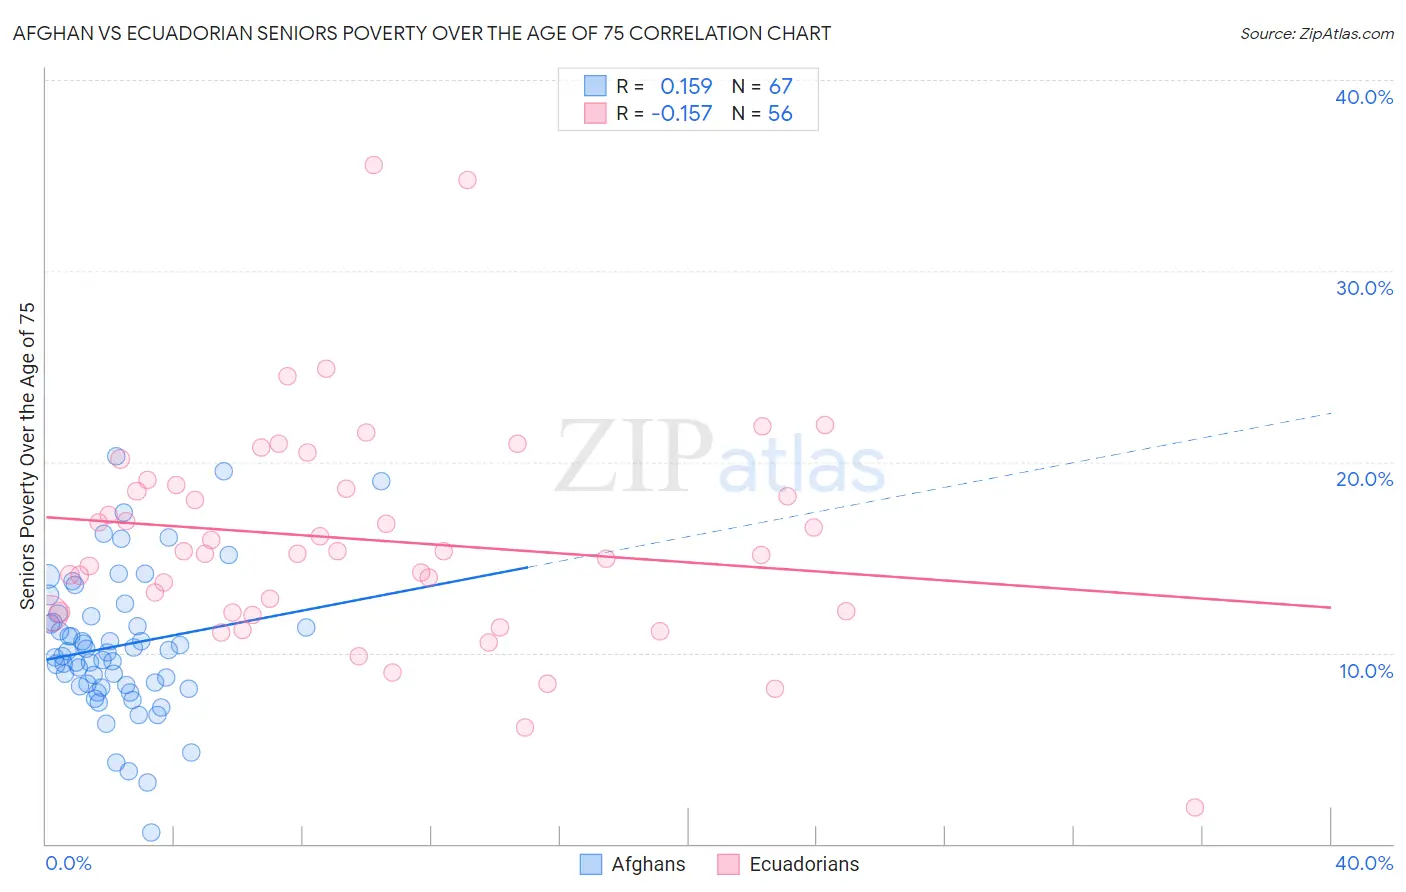
Afghan vs Ecuadorian Seniors Poverty Over the Age of 75 Correlation Chart
The statistical analysis conducted on geographies consisting of 148,083,803 people shows a poor positive correlation between the proportion of Afghans and poverty level among seniors over the age of 75 in the United States with a correlation coefficient (R) of 0.159 and weighted average of 11.2%. Similarly, the statistical analysis conducted on geographies consisting of 314,971,208 people shows a poor negative correlation between the proportion of Ecuadorians and poverty level among seniors over the age of 75 in the United States with a correlation coefficient (R) of -0.157 and weighted average of 15.7%, a difference of 40.6%.
Seniors Poverty Over the Age of 75 Correlation Summary
| Measurement | Afghan | Ecuadorian |
| Minimum | 0.56% | 1.9% |
| Maximum | 20.3% | 35.5% |
| Range | 19.7% | 33.7% |
| Mean | 10.4% | 15.9% |
| Median | 10.0% | 15.2% |
| Interquartile 25% (IQ1) | 8.3% | 12.1% |
| Interquartile 75% (IQ3) | 11.9% | 18.7% |
| Interquartile Range (IQR) | 3.7% | 6.6% |
| Standard Deviation (Sample) | 3.7% | 5.9% |
| Standard Deviation (Population) | 3.7% | 5.8% |
Similar Demographics by Seniors Poverty Over the Age of 75
Demographics Similar to Afghans by Seniors Poverty Over the Age of 75
In terms of seniors poverty over the age of 75, the demographic groups most similar to Afghans are Hungarian (11.2%, a difference of 0.070%), Slavic (11.2%, a difference of 0.090%), Immigrants from England (11.2%, a difference of 0.32%), Immigrants from Canada (11.2%, a difference of 0.32%), and Yugoslavian (11.2%, a difference of 0.35%).
| Demographics | Rating | Rank | Seniors Poverty Over the Age of 75 |
| Hawaiians | 98.8 /100 | #47 | Exceptional 11.1% |
| French | 98.7 /100 | #48 | Exceptional 11.1% |
| Samoans | 98.7 /100 | #49 | Exceptional 11.1% |
| Serbians | 98.6 /100 | #50 | Exceptional 11.1% |
| Immigrants | North Macedonia | 98.6 /100 | #51 | Exceptional 11.1% |
| Zimbabweans | 98.5 /100 | #52 | Exceptional 11.2% |
| Immigrants | England | 98.4 /100 | #53 | Exceptional 11.2% |
| Afghans | 98.2 /100 | #54 | Exceptional 11.2% |
| Hungarians | 98.1 /100 | #55 | Exceptional 11.2% |
| Slavs | 98.1 /100 | #56 | Exceptional 11.2% |
| Immigrants | Canada | 97.9 /100 | #57 | Exceptional 11.2% |
| Yugoslavians | 97.9 /100 | #58 | Exceptional 11.2% |
| Immigrants | Netherlands | 97.8 /100 | #59 | Exceptional 11.2% |
| Eastern Europeans | 97.7 /100 | #60 | Exceptional 11.3% |
| Canadians | 97.7 /100 | #61 | Exceptional 11.3% |
Demographics Similar to Ecuadorians by Seniors Poverty Over the Age of 75
In terms of seniors poverty over the age of 75, the demographic groups most similar to Ecuadorians are Immigrants from Trinidad and Tobago (15.7%, a difference of 0.040%), Hispanic or Latino (15.8%, a difference of 0.16%), Immigrants from Honduras (15.7%, a difference of 0.22%), Immigrants from West Indies (15.8%, a difference of 0.30%), and Immigrants from Bangladesh (15.8%, a difference of 0.34%).
| Demographics | Rating | Rank | Seniors Poverty Over the Age of 75 |
| Natives/Alaskans | 0.0 /100 | #298 | Tragic 15.5% |
| Spanish American Indians | 0.0 /100 | #299 | Tragic 15.5% |
| Bahamians | 0.0 /100 | #300 | Tragic 15.5% |
| Immigrants | Latin America | 0.0 /100 | #301 | Tragic 15.6% |
| West Indians | 0.0 /100 | #302 | Tragic 15.7% |
| Immigrants | Honduras | 0.0 /100 | #303 | Tragic 15.7% |
| Immigrants | Trinidad and Tobago | 0.0 /100 | #304 | Tragic 15.7% |
| Ecuadorians | 0.0 /100 | #305 | Tragic 15.7% |
| Hispanics or Latinos | 0.0 /100 | #306 | Tragic 15.8% |
| Immigrants | West Indies | 0.0 /100 | #307 | Tragic 15.8% |
| Immigrants | Bangladesh | 0.0 /100 | #308 | Tragic 15.8% |
| Yup'ik | 0.0 /100 | #309 | Tragic 15.8% |
| Vietnamese | 0.0 /100 | #310 | Tragic 15.9% |
| Trinidadians and Tobagonians | 0.0 /100 | #311 | Tragic 15.9% |
| Crow | 0.0 /100 | #312 | Tragic 15.9% |