Immigrants from Ethiopia vs Immigrants from Canada Poverty
COMPARE
Immigrants from Ethiopia
Immigrants from Canada
Poverty
Poverty Comparison
Immigrants from Ethiopia
Immigrants from Canada
12.2%
POVERTY
58.6/ 100
METRIC RATING
163rd/ 347
METRIC RANK
11.3%
POVERTY
97.3/ 100
METRIC RATING
70th/ 347
METRIC RANK
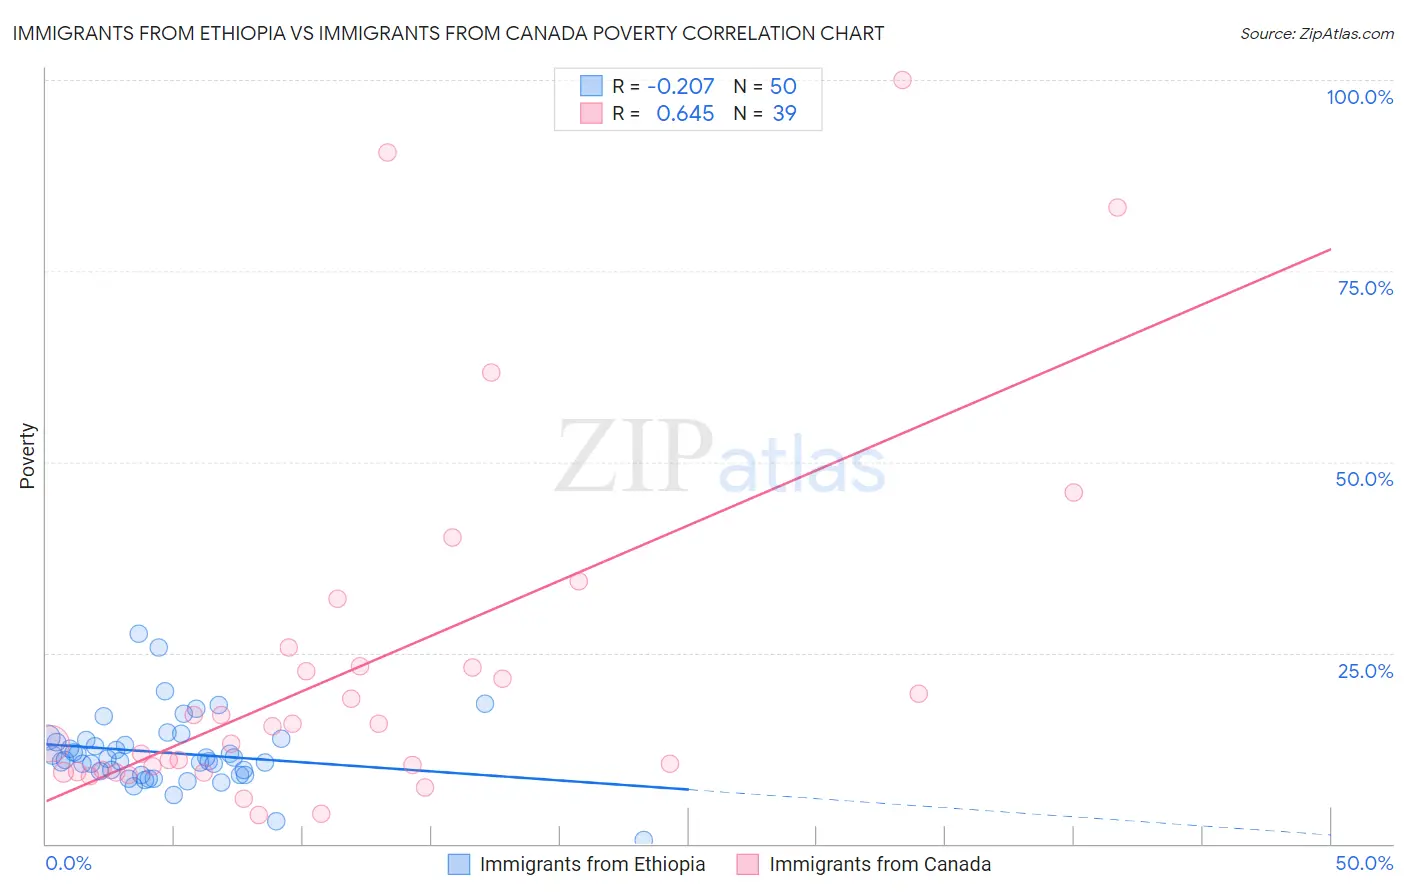
Immigrants from Ethiopia vs Immigrants from Canada Poverty Correlation Chart
The statistical analysis conducted on geographies consisting of 211,460,176 people shows a weak negative correlation between the proportion of Immigrants from Ethiopia and poverty level in the United States with a correlation coefficient (R) of -0.207 and weighted average of 12.2%. Similarly, the statistical analysis conducted on geographies consisting of 459,107,788 people shows a significant positive correlation between the proportion of Immigrants from Canada and poverty level in the United States with a correlation coefficient (R) of 0.645 and weighted average of 11.3%, a difference of 8.6%.
Poverty Correlation Summary
| Measurement | Immigrants from Ethiopia | Immigrants from Canada |
| Minimum | 0.57% | 3.8% |
| Maximum | 27.5% | 100.0% |
| Range | 26.9% | 96.2% |
| Mean | 11.9% | 23.1% |
| Median | 11.0% | 15.4% |
| Interquartile 25% (IQ1) | 9.0% | 9.4% |
| Interquartile 75% (IQ3) | 13.6% | 23.2% |
| Interquartile Range (IQR) | 4.6% | 13.8% |
| Standard Deviation (Sample) | 4.7% | 23.3% |
| Standard Deviation (Population) | 4.6% | 23.0% |
Similar Demographics by Poverty
Demographics Similar to Immigrants from Ethiopia by Poverty
In terms of poverty, the demographic groups most similar to Immigrants from Ethiopia are Ethiopian (12.2%, a difference of 0.050%), Immigrants from Fiji (12.2%, a difference of 0.060%), Colombian (12.2%, a difference of 0.070%), Immigrants from Albania (12.2%, a difference of 0.080%), and Venezuelan (12.2%, a difference of 0.17%).
| Demographics | Rating | Rank | Poverty |
| Scotch-Irish | 62.6 /100 | #156 | Good 12.2% |
| Costa Ricans | 62.2 /100 | #157 | Good 12.2% |
| Taiwanese | 61.8 /100 | #158 | Good 12.2% |
| Pennsylvania Germans | 60.8 /100 | #159 | Good 12.2% |
| Immigrants | Nepal | 60.4 /100 | #160 | Good 12.2% |
| Immigrants | Fiji | 59.1 /100 | #161 | Average 12.2% |
| Ethiopians | 59.1 /100 | #162 | Average 12.2% |
| Immigrants | Ethiopia | 58.6 /100 | #163 | Average 12.2% |
| Colombians | 57.8 /100 | #164 | Average 12.2% |
| Immigrants | Albania | 57.7 /100 | #165 | Average 12.2% |
| Venezuelans | 56.9 /100 | #166 | Average 12.2% |
| Immigrants | Chile | 56.7 /100 | #167 | Average 12.2% |
| Immigrants | Venezuela | 56.5 /100 | #168 | Average 12.2% |
| Whites/Caucasians | 55.4 /100 | #169 | Average 12.3% |
| Immigrants | Oceania | 54.6 /100 | #170 | Average 12.3% |
Demographics Similar to Immigrants from Canada by Poverty
In terms of poverty, the demographic groups most similar to Immigrants from Canada are Zimbabwean (11.3%, a difference of 0.020%), European (11.3%, a difference of 0.040%), Immigrants from Belgium (11.3%, a difference of 0.040%), Serbian (11.2%, a difference of 0.090%), and Carpatho Rusyn (11.3%, a difference of 0.090%).
| Demographics | Rating | Rank | Poverty |
| Ukrainians | 97.8 /100 | #63 | Exceptional 11.2% |
| Swiss | 97.7 /100 | #64 | Exceptional 11.2% |
| Immigrants | Asia | 97.5 /100 | #65 | Exceptional 11.2% |
| Immigrants | Netherlands | 97.5 /100 | #66 | Exceptional 11.2% |
| Immigrants | Australia | 97.4 /100 | #67 | Exceptional 11.2% |
| Slovaks | 97.4 /100 | #68 | Exceptional 11.2% |
| Serbians | 97.4 /100 | #69 | Exceptional 11.2% |
| Immigrants | Canada | 97.3 /100 | #70 | Exceptional 11.3% |
| Zimbabweans | 97.3 /100 | #71 | Exceptional 11.3% |
| Europeans | 97.2 /100 | #72 | Exceptional 11.3% |
| Immigrants | Belgium | 97.2 /100 | #73 | Exceptional 11.3% |
| Carpatho Rusyns | 97.2 /100 | #74 | Exceptional 11.3% |
| Immigrants | Eastern Europe | 97.0 /100 | #75 | Exceptional 11.3% |
| Immigrants | North America | 96.8 /100 | #76 | Exceptional 11.3% |
| Immigrants | Eastern Asia | 96.7 /100 | #77 | Exceptional 11.3% |