Immigrants from England vs Immigrants from North America Child Poverty Under the Age of 16
COMPARE
Immigrants from England
Immigrants from North America
Child Poverty Under the Age of 16
Child Poverty Under the Age of 16 Comparison
Immigrants from England
Immigrants from North America
14.8%
CHILD POVERTY UNDER THE AGE OF 16
94.8/ 100
METRIC RATING
104th/ 347
METRIC RANK
14.6%
CHILD POVERTY UNDER THE AGE OF 16
96.7/ 100
METRIC RATING
91st/ 347
METRIC RANK
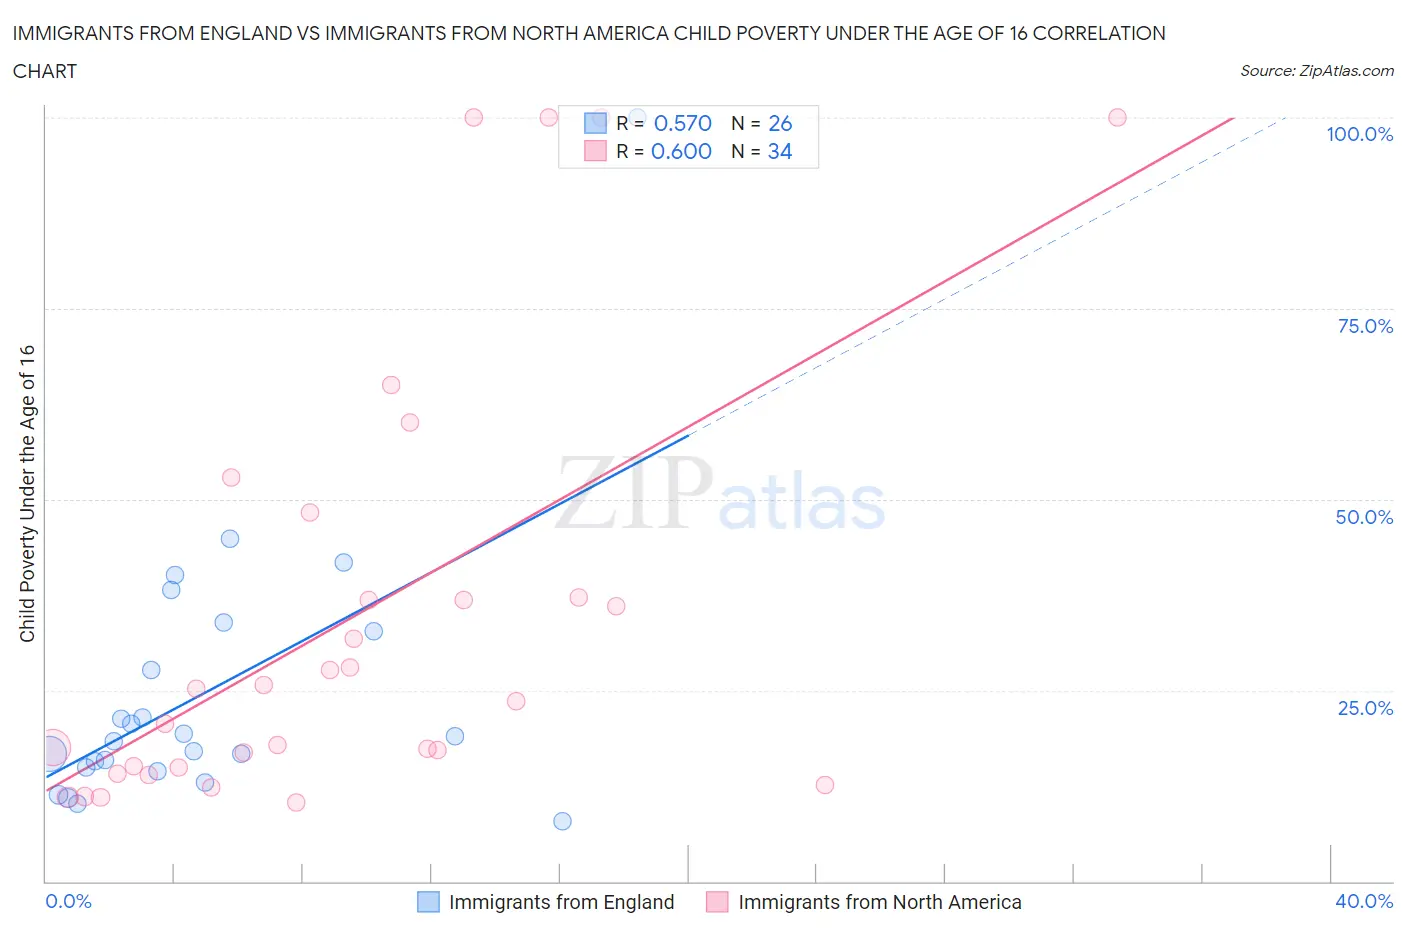
Immigrants from England vs Immigrants from North America Child Poverty Under the Age of 16 Correlation Chart
The statistical analysis conducted on geographies consisting of 387,672,551 people shows a substantial positive correlation between the proportion of Immigrants from England and poverty level among children under the age of 16 in the United States with a correlation coefficient (R) of 0.570 and weighted average of 14.8%. Similarly, the statistical analysis conducted on geographies consisting of 455,942,251 people shows a substantial positive correlation between the proportion of Immigrants from North America and poverty level among children under the age of 16 in the United States with a correlation coefficient (R) of 0.600 and weighted average of 14.6%, a difference of 1.6%.
Child Poverty Under the Age of 16 Correlation Summary
| Measurement | Immigrants from England | Immigrants from North America |
| Minimum | 7.8% | 10.3% |
| Maximum | 100.0% | 100.0% |
| Range | 92.2% | 89.7% |
| Mean | 24.7% | 34.4% |
| Median | 18.6% | 24.4% |
| Interquartile 25% (IQ1) | 14.9% | 14.9% |
| Interquartile 75% (IQ3) | 32.7% | 37.1% |
| Interquartile Range (IQR) | 17.8% | 22.2% |
| Standard Deviation (Sample) | 18.6% | 28.2% |
| Standard Deviation (Population) | 18.2% | 27.7% |
Demographics Similar to Immigrants from England and Immigrants from North America by Child Poverty Under the Age of 16
In terms of child poverty under the age of 16, the demographic groups most similar to Immigrants from England are Immigrants from Egypt (14.8%, a difference of 0.040%), Romanian (14.8%, a difference of 0.090%), Basque (14.8%, a difference of 0.11%), Immigrants from Switzerland (14.8%, a difference of 0.16%), and Dutch (14.8%, a difference of 0.17%). Similarly, the demographic groups most similar to Immigrants from North America are Immigrants from Italy (14.6%, a difference of 0.030%), Argentinean (14.6%, a difference of 0.12%), Austrian (14.5%, a difference of 0.18%), German (14.5%, a difference of 0.25%), and Northern European (14.5%, a difference of 0.30%).
| Demographics | Rating | Rank | Child Poverty Under the Age of 16 |
| Taiwanese | 97.1 /100 | #87 | Exceptional 14.5% |
| Northern Europeans | 97.0 /100 | #88 | Exceptional 14.5% |
| Germans | 96.9 /100 | #89 | Exceptional 14.5% |
| Austrians | 96.9 /100 | #90 | Exceptional 14.5% |
| Immigrants | North America | 96.7 /100 | #91 | Exceptional 14.6% |
| Immigrants | Italy | 96.7 /100 | #92 | Exceptional 14.6% |
| Argentineans | 96.6 /100 | #93 | Exceptional 14.6% |
| Immigrants | South Africa | 96.3 /100 | #94 | Exceptional 14.6% |
| Immigrants | Croatia | 96.1 /100 | #95 | Exceptional 14.6% |
| Immigrants | France | 95.8 /100 | #96 | Exceptional 14.7% |
| Paraguayans | 95.7 /100 | #97 | Exceptional 14.7% |
| Immigrants | Belarus | 95.7 /100 | #98 | Exceptional 14.7% |
| British | 95.5 /100 | #99 | Exceptional 14.7% |
| Dutch | 95.1 /100 | #100 | Exceptional 14.8% |
| Immigrants | Switzerland | 95.1 /100 | #101 | Exceptional 14.8% |
| Romanians | 95.0 /100 | #102 | Exceptional 14.8% |
| Immigrants | Egypt | 94.9 /100 | #103 | Exceptional 14.8% |
| Immigrants | England | 94.8 /100 | #104 | Exceptional 14.8% |
| Basques | 94.7 /100 | #105 | Exceptional 14.8% |
| Serbians | 94.5 /100 | #106 | Exceptional 14.8% |
| Chileans | 94.4 /100 | #107 | Exceptional 14.8% |