Immigrants from England vs Immigrants from Senegal Child Poverty Among Girls Under 16
COMPARE
Immigrants from England
Immigrants from Senegal
Child Poverty Among Girls Under 16
Child Poverty Among Girls Under 16 Comparison
Immigrants from England
Immigrants from Senegal
15.1%
CHILD POVERTY AMONG GIRLS UNDER 16
95.1/ 100
METRIC RATING
105th/ 347
METRIC RANK
20.7%
CHILD POVERTY AMONG GIRLS UNDER 16
0.0/ 100
METRIC RATING
294th/ 347
METRIC RANK
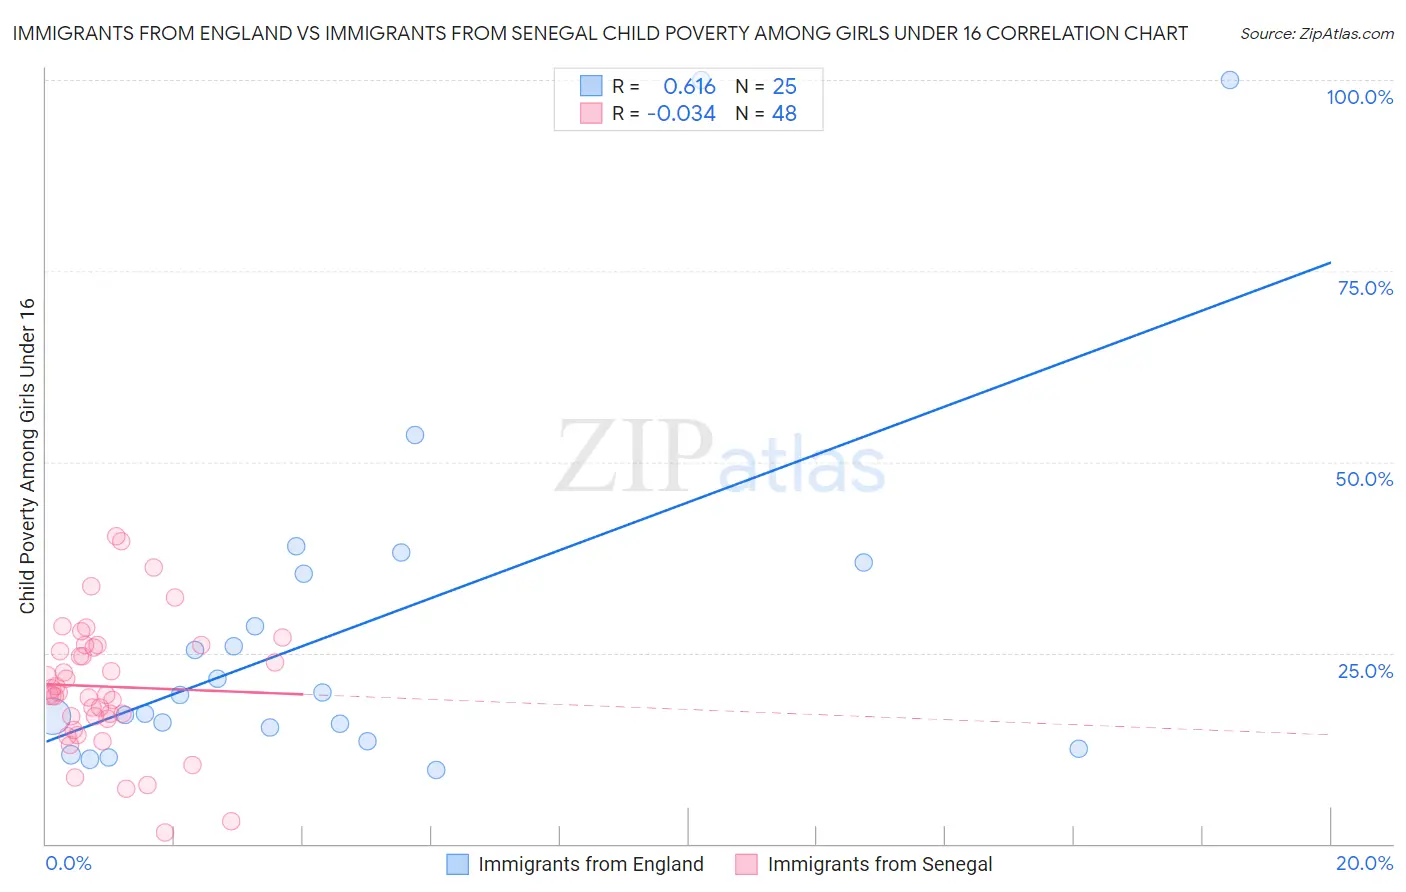
Immigrants from England vs Immigrants from Senegal Child Poverty Among Girls Under 16 Correlation Chart
The statistical analysis conducted on geographies consisting of 383,466,491 people shows a significant positive correlation between the proportion of Immigrants from England and poverty level among girls under the age of 16 in the United States with a correlation coefficient (R) of 0.616 and weighted average of 15.1%. Similarly, the statistical analysis conducted on geographies consisting of 89,874,738 people shows no correlation between the proportion of Immigrants from Senegal and poverty level among girls under the age of 16 in the United States with a correlation coefficient (R) of -0.034 and weighted average of 20.7%, a difference of 37.3%.
Child Poverty Among Girls Under 16 Correlation Summary
| Measurement | Immigrants from England | Immigrants from Senegal |
| Minimum | 9.7% | 1.5% |
| Maximum | 100.0% | 40.3% |
| Range | 90.3% | 38.7% |
| Mean | 28.4% | 20.6% |
| Median | 19.5% | 19.6% |
| Interquartile 25% (IQ1) | 14.3% | 16.5% |
| Interquartile 75% (IQ3) | 36.1% | 25.8% |
| Interquartile Range (IQR) | 21.8% | 9.3% |
| Standard Deviation (Sample) | 24.2% | 8.4% |
| Standard Deviation (Population) | 23.7% | 8.3% |
Similar Demographics by Child Poverty Among Girls Under 16
Demographics Similar to Immigrants from England by Child Poverty Among Girls Under 16
In terms of child poverty among girls under 16, the demographic groups most similar to Immigrants from England are Chilean (15.1%, a difference of 0.010%), Immigrants from Ukraine (15.1%, a difference of 0.070%), Romanian (15.0%, a difference of 0.14%), Immigrants from Brazil (15.1%, a difference of 0.14%), and Serbian (15.1%, a difference of 0.23%).
| Demographics | Rating | Rank | Child Poverty Among Girls Under 16 |
| Basques | 95.9 /100 | #98 | Exceptional 15.0% |
| Immigrants | Egypt | 95.7 /100 | #99 | Exceptional 15.0% |
| Paraguayans | 95.7 /100 | #100 | Exceptional 15.0% |
| Immigrants | South Africa | 95.6 /100 | #101 | Exceptional 15.0% |
| Immigrants | Malaysia | 95.6 /100 | #102 | Exceptional 15.0% |
| British | 95.6 /100 | #103 | Exceptional 15.0% |
| Romanians | 95.3 /100 | #104 | Exceptional 15.0% |
| Immigrants | England | 95.1 /100 | #105 | Exceptional 15.1% |
| Chileans | 95.1 /100 | #106 | Exceptional 15.1% |
| Immigrants | Ukraine | 95.0 /100 | #107 | Exceptional 15.1% |
| Immigrants | Brazil | 94.9 /100 | #108 | Exceptional 15.1% |
| Serbians | 94.8 /100 | #109 | Exceptional 15.1% |
| Immigrants | Croatia | 94.6 /100 | #110 | Exceptional 15.1% |
| Palestinians | 94.5 /100 | #111 | Exceptional 15.1% |
| Immigrants | Kazakhstan | 94.3 /100 | #112 | Exceptional 15.1% |
Demographics Similar to Immigrants from Senegal by Child Poverty Among Girls Under 16
In terms of child poverty among girls under 16, the demographic groups most similar to Immigrants from Senegal are Immigrants from Caribbean (20.7%, a difference of 0.030%), Immigrants from Grenada (20.7%, a difference of 0.11%), Immigrants from Latin America (20.6%, a difference of 0.15%), Chippewa (20.6%, a difference of 0.22%), and Immigrants from West Indies (20.7%, a difference of 0.31%).
| Demographics | Rating | Rank | Child Poverty Among Girls Under 16 |
| Blackfeet | 0.0 /100 | #287 | Tragic 20.5% |
| Haitians | 0.0 /100 | #288 | Tragic 20.5% |
| Immigrants | Belize | 0.0 /100 | #289 | Tragic 20.6% |
| Immigrants | Haiti | 0.0 /100 | #290 | Tragic 20.6% |
| Chippewa | 0.0 /100 | #291 | Tragic 20.6% |
| Immigrants | Latin America | 0.0 /100 | #292 | Tragic 20.6% |
| Immigrants | Grenada | 0.0 /100 | #293 | Tragic 20.7% |
| Immigrants | Senegal | 0.0 /100 | #294 | Tragic 20.7% |
| Immigrants | Caribbean | 0.0 /100 | #295 | Tragic 20.7% |
| Immigrants | West Indies | 0.0 /100 | #296 | Tragic 20.7% |
| Inupiat | 0.0 /100 | #297 | Tragic 20.8% |
| Mexicans | 0.0 /100 | #298 | Tragic 20.9% |
| Hispanics or Latinos | 0.0 /100 | #299 | Tragic 21.0% |
| Somalis | 0.0 /100 | #300 | Tragic 21.0% |
| Choctaw | 0.0 /100 | #301 | Tragic 21.1% |