Immigrants from El Salvador vs Austrian Family Poverty
COMPARE
Immigrants from El Salvador
Austrian
Family Poverty
Family Poverty Comparison
Immigrants from El Salvador
Austrians
11.0%
FAMILY POVERTY
0.1/ 100
METRIC RATING
266th/ 347
METRIC RANK
7.8%
FAMILY POVERTY
98.2/ 100
METRIC RATING
73rd/ 347
METRIC RANK
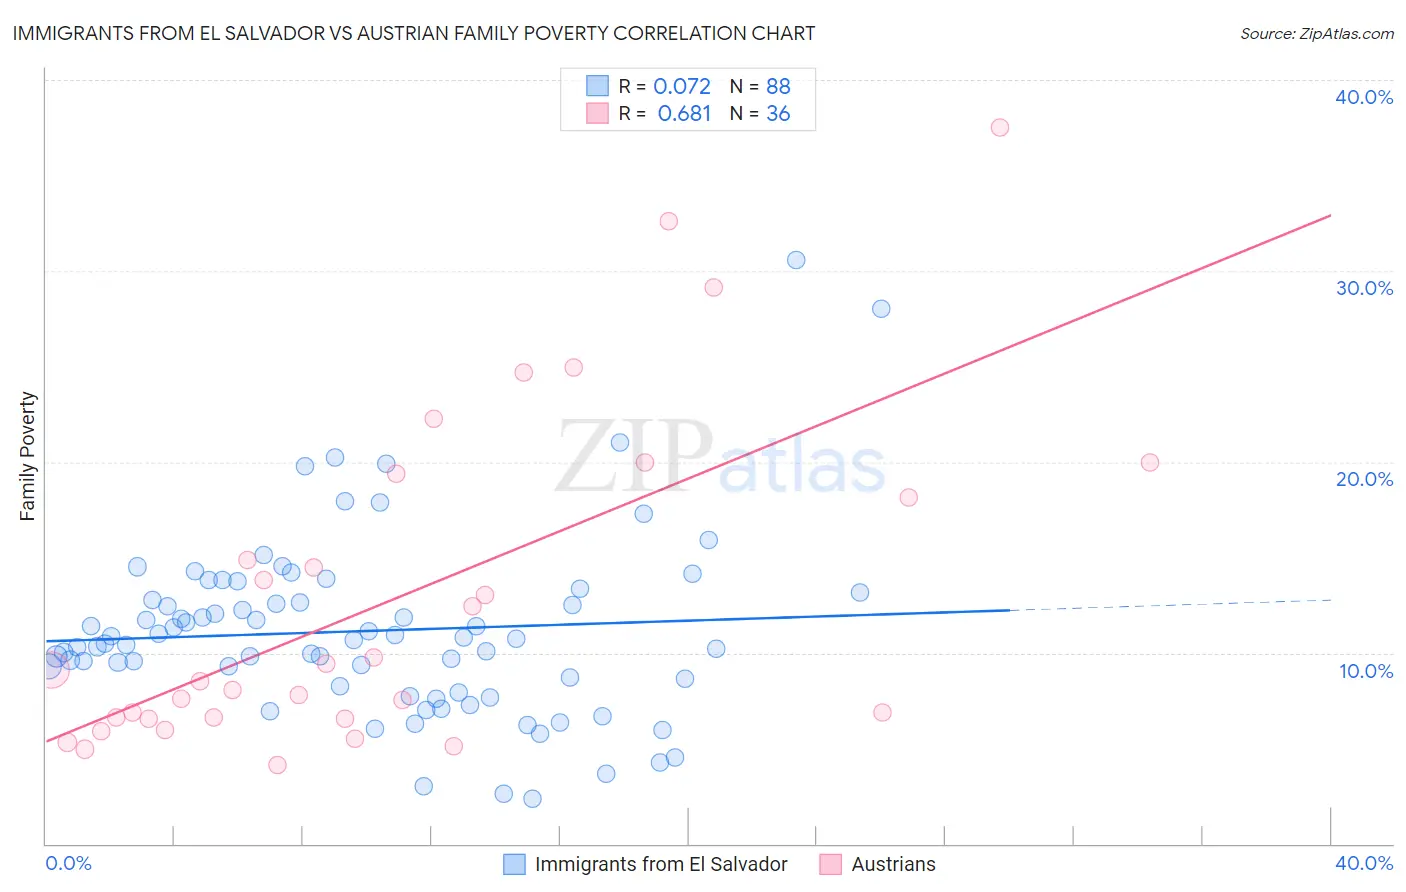
Immigrants from El Salvador vs Austrian Family Poverty Correlation Chart
The statistical analysis conducted on geographies consisting of 357,239,196 people shows a slight positive correlation between the proportion of Immigrants from El Salvador and poverty level among families in the United States with a correlation coefficient (R) of 0.072 and weighted average of 11.0%. Similarly, the statistical analysis conducted on geographies consisting of 450,050,339 people shows a significant positive correlation between the proportion of Austrians and poverty level among families in the United States with a correlation coefficient (R) of 0.681 and weighted average of 7.8%, a difference of 41.1%.
Family Poverty Correlation Summary
| Measurement | Immigrants from El Salvador | Austrian |
| Minimum | 2.4% | 4.1% |
| Maximum | 30.5% | 37.5% |
| Range | 28.2% | 33.4% |
| Mean | 11.1% | 12.8% |
| Median | 10.7% | 8.8% |
| Interquartile 25% (IQ1) | 8.4% | 6.6% |
| Interquartile 75% (IQ3) | 13.0% | 18.8% |
| Interquartile Range (IQR) | 4.5% | 12.2% |
| Standard Deviation (Sample) | 4.8% | 8.6% |
| Standard Deviation (Population) | 4.7% | 8.5% |
Similar Demographics by Family Poverty
Demographics Similar to Immigrants from El Salvador by Family Poverty
In terms of family poverty, the demographic groups most similar to Immigrants from El Salvador are Comanche (11.0%, a difference of 0.010%), Jamaican (11.1%, a difference of 0.12%), Immigrants from Ecuador (11.1%, a difference of 0.60%), Immigrants from Nicaragua (11.1%, a difference of 0.60%), and Immigrants from Bahamas (11.1%, a difference of 0.85%).
| Demographics | Rating | Rank | Family Poverty |
| Mexican American Indians | 0.2 /100 | #259 | Tragic 10.9% |
| Bangladeshis | 0.2 /100 | #260 | Tragic 10.9% |
| Shoshone | 0.2 /100 | #261 | Tragic 10.9% |
| Spanish American Indians | 0.2 /100 | #262 | Tragic 10.9% |
| Cape Verdeans | 0.1 /100 | #263 | Tragic 10.9% |
| Trinidadians and Tobagonians | 0.1 /100 | #264 | Tragic 10.9% |
| Immigrants | Trinidad and Tobago | 0.1 /100 | #265 | Tragic 10.9% |
| Immigrants | El Salvador | 0.1 /100 | #266 | Tragic 11.0% |
| Comanche | 0.1 /100 | #267 | Tragic 11.0% |
| Jamaicans | 0.1 /100 | #268 | Tragic 11.1% |
| Immigrants | Ecuador | 0.1 /100 | #269 | Tragic 11.1% |
| Immigrants | Nicaragua | 0.1 /100 | #270 | Tragic 11.1% |
| Immigrants | Bahamas | 0.1 /100 | #271 | Tragic 11.1% |
| Immigrants | Jamaica | 0.1 /100 | #272 | Tragic 11.2% |
| Somalis | 0.1 /100 | #273 | Tragic 11.2% |
Demographics Similar to Austrians by Family Poverty
In terms of family poverty, the demographic groups most similar to Austrians are Immigrants from Romania (7.8%, a difference of 0.0%), Cambodian (7.8%, a difference of 0.060%), Immigrants from China (7.8%, a difference of 0.070%), Immigrants from Canada (7.8%, a difference of 0.080%), and Immigrants from Belgium (7.8%, a difference of 0.13%).
| Demographics | Rating | Rank | Family Poverty |
| Dutch | 98.3 /100 | #66 | Exceptional 7.8% |
| Northern Europeans | 98.3 /100 | #67 | Exceptional 7.8% |
| Australians | 98.2 /100 | #68 | Exceptional 7.8% |
| Immigrants | Belgium | 98.2 /100 | #69 | Exceptional 7.8% |
| Immigrants | Canada | 98.2 /100 | #70 | Exceptional 7.8% |
| Cambodians | 98.2 /100 | #71 | Exceptional 7.8% |
| Immigrants | Romania | 98.2 /100 | #72 | Exceptional 7.8% |
| Austrians | 98.2 /100 | #73 | Exceptional 7.8% |
| Immigrants | China | 98.1 /100 | #74 | Exceptional 7.8% |
| Immigrants | Croatia | 98.1 /100 | #75 | Exceptional 7.8% |
| Immigrants | Latvia | 98.0 /100 | #76 | Exceptional 7.9% |
| Ukrainians | 98.0 /100 | #77 | Exceptional 7.9% |
| Immigrants | North America | 97.9 /100 | #78 | Exceptional 7.9% |
| Immigrants | Europe | 97.8 /100 | #79 | Exceptional 7.9% |
| English | 97.8 /100 | #80 | Exceptional 7.9% |