Immigrants from El Salvador vs Costa Rican 2nd Grade
COMPARE
Immigrants from El Salvador
Costa Rican
2nd Grade
2nd Grade Comparison
Immigrants from El Salvador
Costa Ricans
95.9%
2ND GRADE
0.0/ 100
METRIC RATING
345th/ 347
METRIC RANK
97.7%
2ND GRADE
10.5/ 100
METRIC RATING
210th/ 347
METRIC RANK
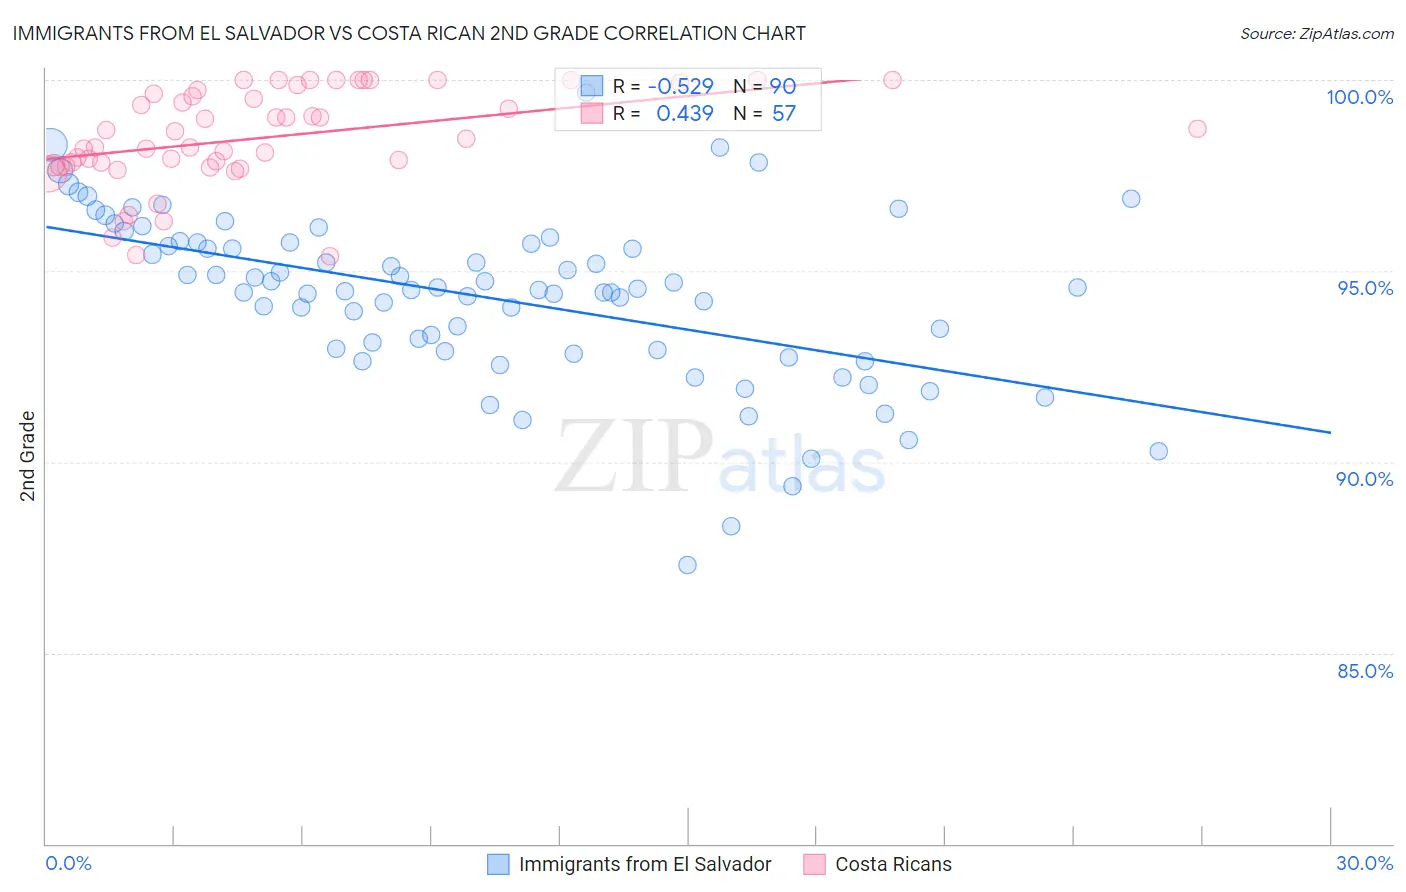
Immigrants from El Salvador vs Costa Rican 2nd Grade Correlation Chart
The statistical analysis conducted on geographies consisting of 357,852,938 people shows a substantial negative correlation between the proportion of Immigrants from El Salvador and percentage of population with at least 2nd grade education in the United States with a correlation coefficient (R) of -0.529 and weighted average of 95.9%. Similarly, the statistical analysis conducted on geographies consisting of 253,599,979 people shows a moderate positive correlation between the proportion of Costa Ricans and percentage of population with at least 2nd grade education in the United States with a correlation coefficient (R) of 0.439 and weighted average of 97.7%, a difference of 1.9%.
2nd Grade Correlation Summary
| Measurement | Immigrants from El Salvador | Costa Rican |
| Minimum | 87.3% | 95.4% |
| Maximum | 99.7% | 100.0% |
| Range | 12.4% | 4.6% |
| Mean | 94.3% | 98.5% |
| Median | 94.5% | 98.5% |
| Interquartile 25% (IQ1) | 92.9% | 97.8% |
| Interquartile 75% (IQ3) | 95.7% | 99.7% |
| Interquartile Range (IQR) | 2.8% | 1.9% |
| Standard Deviation (Sample) | 2.2% | 1.3% |
| Standard Deviation (Population) | 2.2% | 1.2% |
Similar Demographics by 2nd Grade
Demographics Similar to Immigrants from El Salvador by 2nd Grade
In terms of 2nd grade, the demographic groups most similar to Immigrants from El Salvador are Immigrants from Yemen (95.7%, a difference of 0.14%), Salvadoran (96.0%, a difference of 0.16%), Nepalese (96.1%, a difference of 0.20%), Immigrants from Mexico (96.1%, a difference of 0.29%), and Immigrants from Central America (96.2%, a difference of 0.31%).
| Demographics | Rating | Rank | 2nd Grade |
| Immigrants | Dominican Republic | 0.0 /100 | #333 | Tragic 96.4% |
| Central Americans | 0.0 /100 | #334 | Tragic 96.4% |
| Yakama | 0.0 /100 | #335 | Tragic 96.4% |
| Immigrants | Fiji | 0.0 /100 | #336 | Tragic 96.4% |
| Immigrants | Cambodia | 0.0 /100 | #337 | Tragic 96.4% |
| Immigrants | Cabo Verde | 0.0 /100 | #338 | Tragic 96.3% |
| Guatemalans | 0.0 /100 | #339 | Tragic 96.3% |
| Immigrants | Guatemala | 0.0 /100 | #340 | Tragic 96.2% |
| Immigrants | Central America | 0.0 /100 | #341 | Tragic 96.2% |
| Immigrants | Mexico | 0.0 /100 | #342 | Tragic 96.1% |
| Nepalese | 0.0 /100 | #343 | Tragic 96.1% |
| Salvadorans | 0.0 /100 | #344 | Tragic 96.0% |
| Immigrants | El Salvador | 0.0 /100 | #345 | Tragic 95.9% |
| Immigrants | Yemen | 0.0 /100 | #346 | Tragic 95.7% |
| Spanish American Indians | 0.0 /100 | #347 | Tragic 95.6% |
Demographics Similar to Costa Ricans by 2nd Grade
In terms of 2nd grade, the demographic groups most similar to Costa Ricans are Immigrants from Oceania (97.7%, a difference of 0.0%), Laotian (97.7%, a difference of 0.0%), Immigrants from Northern Africa (97.7%, a difference of 0.010%), Immigrants from Bahamas (97.7%, a difference of 0.020%), and Moroccan (97.7%, a difference of 0.020%).
| Demographics | Rating | Rank | 2nd Grade |
| Yuman | 20.0 /100 | #203 | Fair 97.8% |
| Immigrants | Albania | 18.4 /100 | #204 | Poor 97.8% |
| Immigrants | Southern Europe | 18.1 /100 | #205 | Poor 97.8% |
| Immigrants | Chile | 17.3 /100 | #206 | Poor 97.7% |
| Africans | 15.6 /100 | #207 | Poor 97.7% |
| Immigrants | Northern Africa | 12.3 /100 | #208 | Poor 97.7% |
| Immigrants | Oceania | 10.9 /100 | #209 | Poor 97.7% |
| Costa Ricans | 10.5 /100 | #210 | Poor 97.7% |
| Laotians | 9.9 /100 | #211 | Tragic 97.7% |
| Immigrants | Bahamas | 8.4 /100 | #212 | Tragic 97.7% |
| Moroccans | 8.2 /100 | #213 | Tragic 97.7% |
| Samoans | 7.1 /100 | #214 | Tragic 97.7% |
| Bahamians | 6.8 /100 | #215 | Tragic 97.7% |
| South American Indians | 6.7 /100 | #216 | Tragic 97.7% |
| Uruguayans | 6.2 /100 | #217 | Tragic 97.7% |