Immigrants from Eastern Europe vs Immigrants from Switzerland Child Poverty Under the Age of 5
COMPARE
Immigrants from Eastern Europe
Immigrants from Switzerland
Child Poverty Under the Age of 5
Child Poverty Under the Age of 5 Comparison
Immigrants from Eastern Europe
Immigrants from Switzerland
15.1%
CHILD POVERTY UNDER THE AGE OF 5
99.1/ 100
METRIC RATING
62nd/ 347
METRIC RANK
15.8%
CHILD POVERTY UNDER THE AGE OF 5
96.4/ 100
METRIC RATING
95th/ 347
METRIC RANK
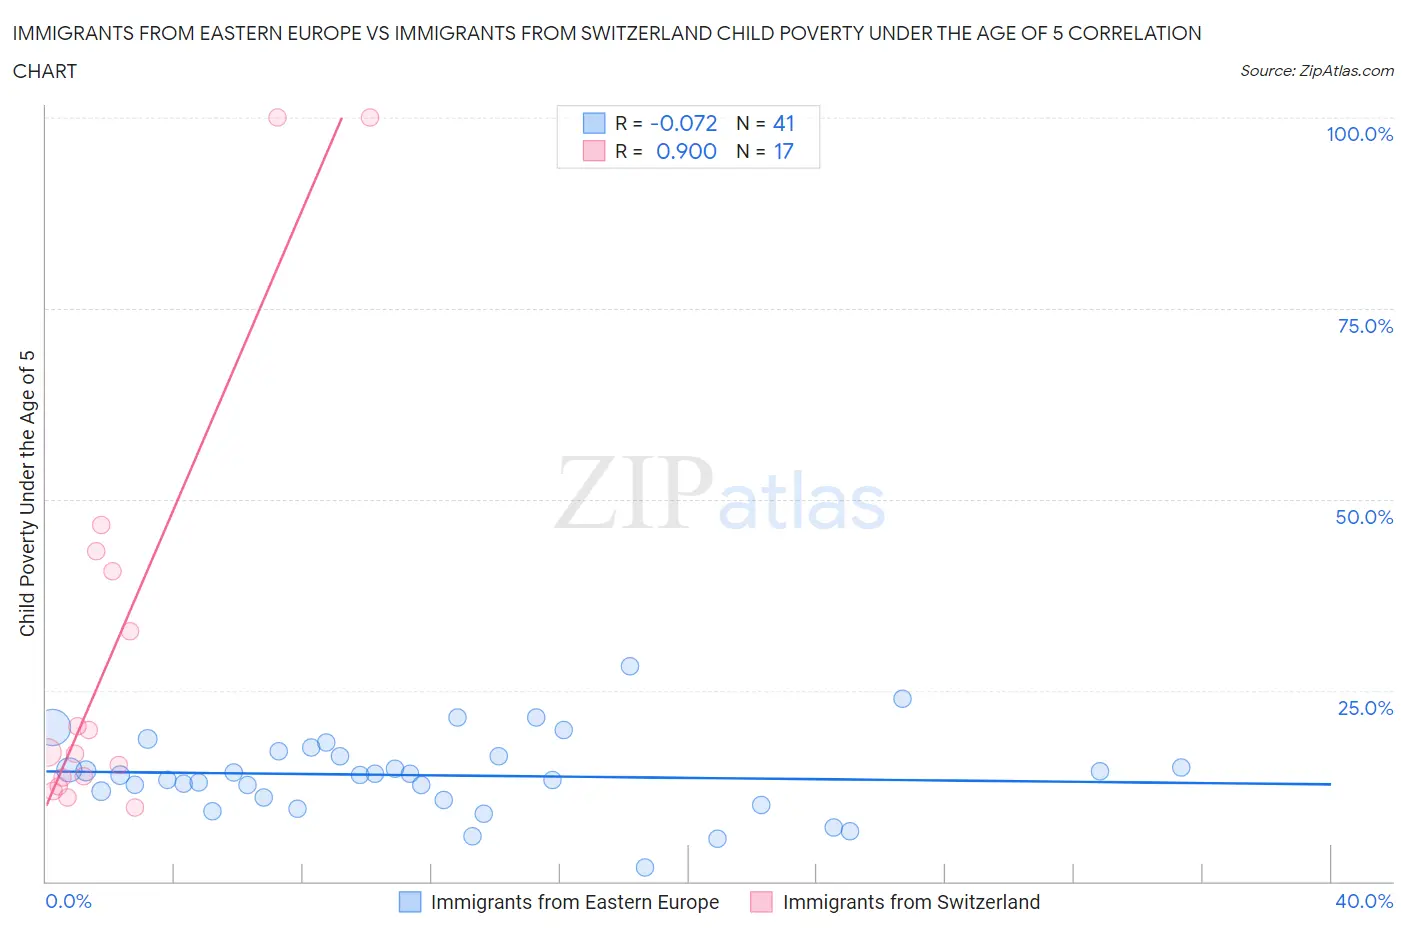
Immigrants from Eastern Europe vs Immigrants from Switzerland Child Poverty Under the Age of 5 Correlation Chart
The statistical analysis conducted on geographies consisting of 448,928,645 people shows a slight negative correlation between the proportion of Immigrants from Eastern Europe and poverty level among children under the age of 5 in the United States with a correlation coefficient (R) of -0.072 and weighted average of 15.1%. Similarly, the statistical analysis conducted on geographies consisting of 143,009,400 people shows a near-perfect positive correlation between the proportion of Immigrants from Switzerland and poverty level among children under the age of 5 in the United States with a correlation coefficient (R) of 0.900 and weighted average of 15.8%, a difference of 4.2%.
Child Poverty Under the Age of 5 Correlation Summary
| Measurement | Immigrants from Eastern Europe | Immigrants from Switzerland |
| Minimum | 1.8% | 9.7% |
| Maximum | 28.1% | 100.0% |
| Range | 26.2% | 90.3% |
| Mean | 13.9% | 30.8% |
| Median | 13.9% | 16.8% |
| Interquartile 25% (IQ1) | 10.8% | 13.0% |
| Interquartile 75% (IQ3) | 16.7% | 41.9% |
| Interquartile Range (IQR) | 5.9% | 28.9% |
| Standard Deviation (Sample) | 5.2% | 28.6% |
| Standard Deviation (Population) | 5.1% | 27.7% |
Similar Demographics by Child Poverty Under the Age of 5
Demographics Similar to Immigrants from Eastern Europe by Child Poverty Under the Age of 5
In terms of child poverty under the age of 5, the demographic groups most similar to Immigrants from Eastern Europe are Immigrants from Poland (15.1%, a difference of 0.12%), Immigrants from Europe (15.1%, a difference of 0.13%), Immigrants from Romania (15.2%, a difference of 0.15%), Immigrants from Fiji (15.2%, a difference of 0.18%), and Immigrants from Scotland (15.2%, a difference of 0.29%).
| Demographics | Rating | Rank | Child Poverty Under the Age of 5 |
| Danes | 99.4 /100 | #55 | Exceptional 14.9% |
| Immigrants | Pakistan | 99.4 /100 | #56 | Exceptional 14.9% |
| Egyptians | 99.4 /100 | #57 | Exceptional 14.9% |
| Swedes | 99.4 /100 | #58 | Exceptional 15.0% |
| Paraguayans | 99.4 /100 | #59 | Exceptional 15.0% |
| Immigrants | Russia | 99.3 /100 | #60 | Exceptional 15.0% |
| Immigrants | Poland | 99.1 /100 | #61 | Exceptional 15.1% |
| Immigrants | Eastern Europe | 99.1 /100 | #62 | Exceptional 15.1% |
| Immigrants | Europe | 99.1 /100 | #63 | Exceptional 15.1% |
| Immigrants | Romania | 99.1 /100 | #64 | Exceptional 15.2% |
| Immigrants | Fiji | 99.0 /100 | #65 | Exceptional 15.2% |
| Immigrants | Scotland | 99.0 /100 | #66 | Exceptional 15.2% |
| Greeks | 99.0 /100 | #67 | Exceptional 15.2% |
| Zimbabweans | 99.0 /100 | #68 | Exceptional 15.2% |
| Lithuanians | 99.0 /100 | #69 | Exceptional 15.2% |
Demographics Similar to Immigrants from Switzerland by Child Poverty Under the Age of 5
In terms of child poverty under the age of 5, the demographic groups most similar to Immigrants from Switzerland are Immigrants from Kazakhstan (15.8%, a difference of 0.13%), Macedonian (15.8%, a difference of 0.17%), Immigrants from South Africa (15.8%, a difference of 0.24%), Palestinian (15.8%, a difference of 0.35%), and Immigrants from Canada (15.8%, a difference of 0.36%).
| Demographics | Rating | Rank | Child Poverty Under the Age of 5 |
| Jordanians | 97.3 /100 | #88 | Exceptional 15.6% |
| Immigrants | Croatia | 97.3 /100 | #89 | Exceptional 15.6% |
| Immigrants | France | 97.3 /100 | #90 | Exceptional 15.6% |
| Poles | 97.2 /100 | #91 | Exceptional 15.7% |
| Scandinavians | 97.1 /100 | #92 | Exceptional 15.7% |
| Ukrainians | 97.1 /100 | #93 | Exceptional 15.7% |
| Immigrants | South Eastern Asia | 97.1 /100 | #94 | Exceptional 15.7% |
| Immigrants | Switzerland | 96.4 /100 | #95 | Exceptional 15.8% |
| Immigrants | Kazakhstan | 96.2 /100 | #96 | Exceptional 15.8% |
| Macedonians | 96.2 /100 | #97 | Exceptional 15.8% |
| Immigrants | South Africa | 96.1 /100 | #98 | Exceptional 15.8% |
| Palestinians | 95.9 /100 | #99 | Exceptional 15.8% |
| Immigrants | Canada | 95.9 /100 | #100 | Exceptional 15.8% |
| Immigrants | Zimbabwe | 95.9 /100 | #101 | Exceptional 15.8% |
| Armenians | 95.7 /100 | #102 | Exceptional 15.8% |