Immigrants from Dominican Republic vs Immigrants from Netherlands Child Poverty Under the Age of 16
COMPARE
Immigrants from Dominican Republic
Immigrants from Netherlands
Child Poverty Under the Age of 16
Child Poverty Under the Age of 16 Comparison
Immigrants from Dominican Republic
Immigrants from Netherlands
24.0%
CHILD POVERTY UNDER THE AGE OF 16
0.0/ 100
METRIC RATING
333rd/ 347
METRIC RANK
14.3%
CHILD POVERTY UNDER THE AGE OF 16
97.9/ 100
METRIC RATING
70th/ 347
METRIC RANK
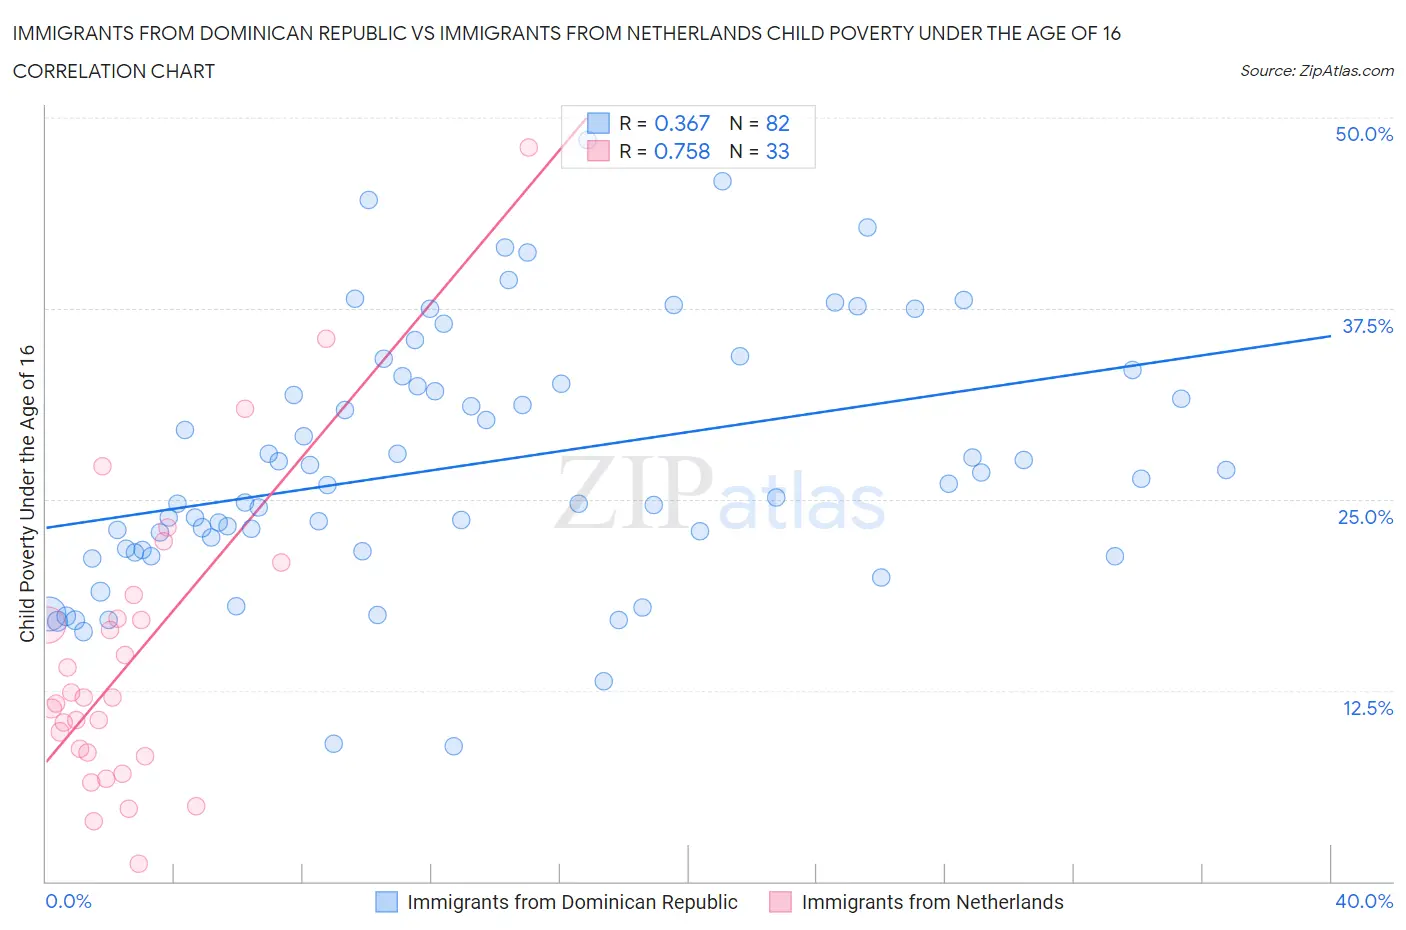
Immigrants from Dominican Republic vs Immigrants from Netherlands Child Poverty Under the Age of 16 Correlation Chart
The statistical analysis conducted on geographies consisting of 273,209,047 people shows a mild positive correlation between the proportion of Immigrants from Dominican Republic and poverty level among children under the age of 16 in the United States with a correlation coefficient (R) of 0.367 and weighted average of 24.0%. Similarly, the statistical analysis conducted on geographies consisting of 236,076,675 people shows a strong positive correlation between the proportion of Immigrants from Netherlands and poverty level among children under the age of 16 in the United States with a correlation coefficient (R) of 0.758 and weighted average of 14.3%, a difference of 67.2%.
Child Poverty Under the Age of 16 Correlation Summary
| Measurement | Immigrants from Dominican Republic | Immigrants from Netherlands |
| Minimum | 8.8% | 1.1% |
| Maximum | 48.5% | 48.1% |
| Range | 39.7% | 46.9% |
| Mean | 27.3% | 14.7% |
| Median | 26.0% | 12.0% |
| Interquartile 25% (IQ1) | 21.7% | 8.3% |
| Interquartile 75% (IQ3) | 32.6% | 17.9% |
| Interquartile Range (IQR) | 10.8% | 9.6% |
| Standard Deviation (Sample) | 8.3% | 9.8% |
| Standard Deviation (Population) | 8.3% | 9.7% |
Similar Demographics by Child Poverty Under the Age of 16
Demographics Similar to Immigrants from Dominican Republic by Child Poverty Under the Age of 16
In terms of child poverty under the age of 16, the demographic groups most similar to Immigrants from Dominican Republic are Pueblo (23.9%, a difference of 0.17%), Apache (23.8%, a difference of 0.55%), Native/Alaskan (23.8%, a difference of 0.78%), Dominican (23.8%, a difference of 0.87%), and Black/African American (24.4%, a difference of 2.0%).
| Demographics | Rating | Rank | Child Poverty Under the Age of 16 |
| Immigrants | Honduras | 0.0 /100 | #326 | Tragic 22.7% |
| Menominee | 0.0 /100 | #327 | Tragic 23.0% |
| Colville | 0.0 /100 | #328 | Tragic 23.0% |
| Dominicans | 0.0 /100 | #329 | Tragic 23.8% |
| Natives/Alaskans | 0.0 /100 | #330 | Tragic 23.8% |
| Apache | 0.0 /100 | #331 | Tragic 23.8% |
| Pueblo | 0.0 /100 | #332 | Tragic 23.9% |
| Immigrants | Dominican Republic | 0.0 /100 | #333 | Tragic 24.0% |
| Blacks/African Americans | 0.0 /100 | #334 | Tragic 24.4% |
| Houma | 0.0 /100 | #335 | Tragic 24.9% |
| Yup'ik | 0.0 /100 | #336 | Tragic 25.1% |
| Sioux | 0.0 /100 | #337 | Tragic 25.2% |
| Cheyenne | 0.0 /100 | #338 | Tragic 25.4% |
| Crow | 0.0 /100 | #339 | Tragic 26.0% |
| Hopi | 0.0 /100 | #340 | Tragic 27.1% |
Demographics Similar to Immigrants from Netherlands by Child Poverty Under the Age of 16
In terms of child poverty under the age of 16, the demographic groups most similar to Immigrants from Netherlands are Immigrants from Poland (14.3%, a difference of 0.0%), Immigrants from Bulgaria (14.3%, a difference of 0.10%), Laotian (14.3%, a difference of 0.18%), Cambodian (14.4%, a difference of 0.23%), and European (14.3%, a difference of 0.28%).
| Demographics | Rating | Rank | Child Poverty Under the Age of 16 |
| Immigrants | Europe | 98.4 /100 | #63 | Exceptional 14.2% |
| Immigrants | Romania | 98.3 /100 | #64 | Exceptional 14.2% |
| Immigrants | Philippines | 98.2 /100 | #65 | Exceptional 14.3% |
| Slovenes | 98.1 /100 | #66 | Exceptional 14.3% |
| Europeans | 98.1 /100 | #67 | Exceptional 14.3% |
| Laotians | 98.0 /100 | #68 | Exceptional 14.3% |
| Immigrants | Bulgaria | 98.0 /100 | #69 | Exceptional 14.3% |
| Immigrants | Netherlands | 97.9 /100 | #70 | Exceptional 14.3% |
| Immigrants | Poland | 97.9 /100 | #71 | Exceptional 14.3% |
| Cambodians | 97.8 /100 | #72 | Exceptional 14.4% |
| Immigrants | Turkey | 97.6 /100 | #73 | Exceptional 14.4% |
| Macedonians | 97.6 /100 | #74 | Exceptional 14.4% |
| Ukrainians | 97.5 /100 | #75 | Exceptional 14.4% |
| Immigrants | Eastern Europe | 97.5 /100 | #76 | Exceptional 14.4% |
| Australians | 97.5 /100 | #77 | Exceptional 14.4% |