Moroccan vs Immigrants from Netherlands Child Poverty Under the Age of 16
COMPARE
Moroccan
Immigrants from Netherlands
Child Poverty Under the Age of 16
Child Poverty Under the Age of 16 Comparison
Moroccans
Immigrants from Netherlands
17.6%
CHILD POVERTY UNDER THE AGE OF 16
5.3/ 100
METRIC RATING
218th/ 347
METRIC RANK
14.3%
CHILD POVERTY UNDER THE AGE OF 16
97.9/ 100
METRIC RATING
70th/ 347
METRIC RANK
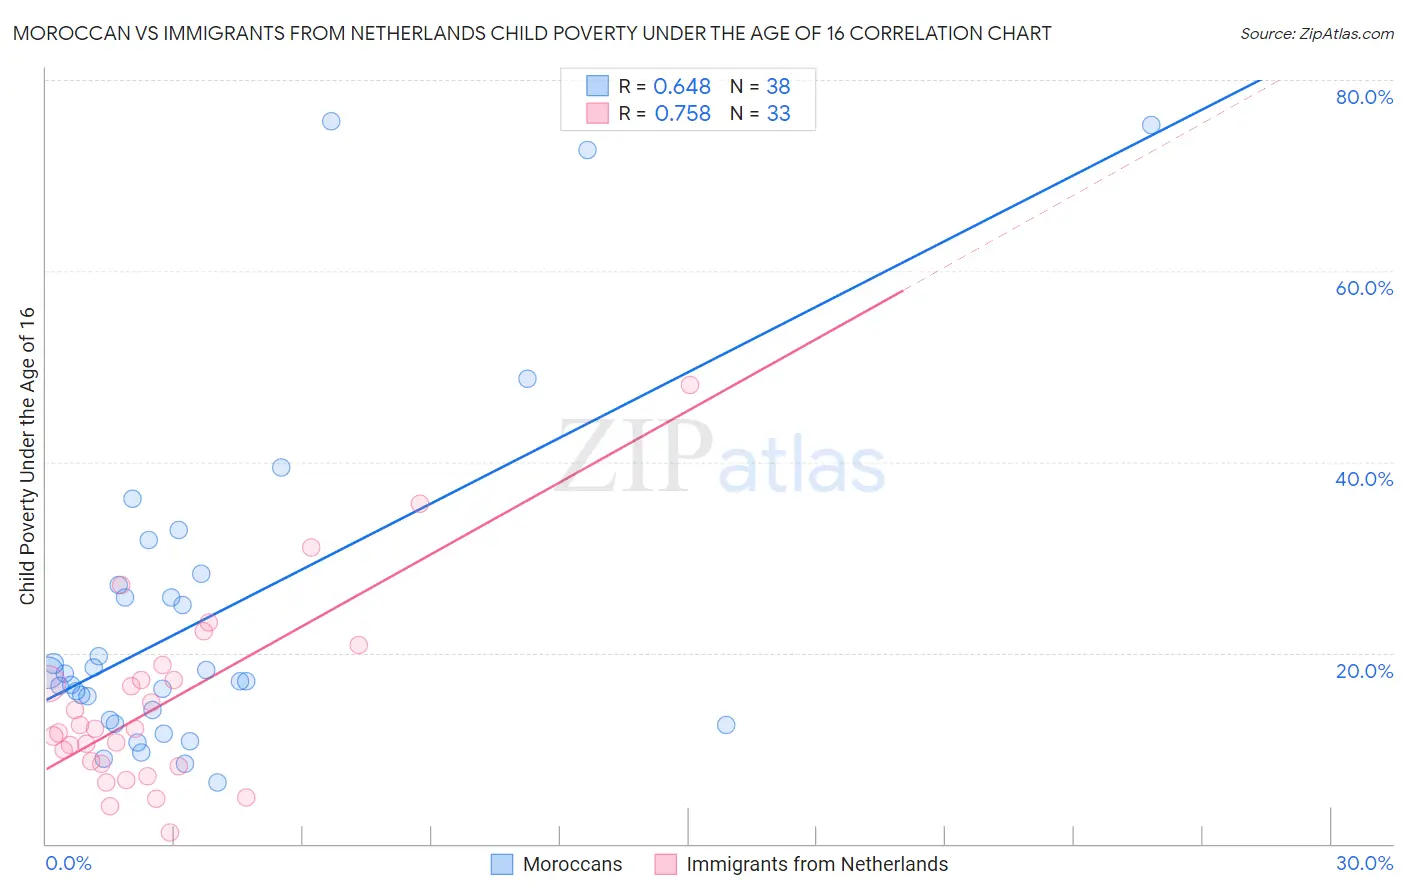
Moroccan vs Immigrants from Netherlands Child Poverty Under the Age of 16 Correlation Chart
The statistical analysis conducted on geographies consisting of 201,029,687 people shows a significant positive correlation between the proportion of Moroccans and poverty level among children under the age of 16 in the United States with a correlation coefficient (R) of 0.648 and weighted average of 17.6%. Similarly, the statistical analysis conducted on geographies consisting of 236,076,675 people shows a strong positive correlation between the proportion of Immigrants from Netherlands and poverty level among children under the age of 16 in the United States with a correlation coefficient (R) of 0.758 and weighted average of 14.3%, a difference of 22.8%.
Child Poverty Under the Age of 16 Correlation Summary
| Measurement | Moroccan | Immigrants from Netherlands |
| Minimum | 6.5% | 1.1% |
| Maximum | 75.7% | 48.1% |
| Range | 69.2% | 46.9% |
| Mean | 23.8% | 14.7% |
| Median | 17.4% | 12.0% |
| Interquartile 25% (IQ1) | 13.0% | 8.3% |
| Interquartile 75% (IQ3) | 27.2% | 17.9% |
| Interquartile Range (IQR) | 14.2% | 9.6% |
| Standard Deviation (Sample) | 17.6% | 9.8% |
| Standard Deviation (Population) | 17.4% | 9.7% |
Similar Demographics by Child Poverty Under the Age of 16
Demographics Similar to Moroccans by Child Poverty Under the Age of 16
In terms of child poverty under the age of 16, the demographic groups most similar to Moroccans are Immigrants from Eastern Africa (17.6%, a difference of 0.010%), Sierra Leonean (17.6%, a difference of 0.19%), Malaysian (17.5%, a difference of 0.31%), Iraqi (17.5%, a difference of 0.33%), and Japanese (17.7%, a difference of 0.36%).
| Demographics | Rating | Rank | Child Poverty Under the Age of 16 |
| Immigrants | Thailand | 6.6 /100 | #211 | Tragic 17.5% |
| Immigrants | Immigrants | 6.5 /100 | #212 | Tragic 17.5% |
| Immigrants | Azores | 6.2 /100 | #213 | Tragic 17.5% |
| Iraqis | 5.9 /100 | #214 | Tragic 17.5% |
| Malaysians | 5.9 /100 | #215 | Tragic 17.5% |
| Sierra Leoneans | 5.7 /100 | #216 | Tragic 17.6% |
| Immigrants | Eastern Africa | 5.3 /100 | #217 | Tragic 17.6% |
| Moroccans | 5.3 /100 | #218 | Tragic 17.6% |
| Japanese | 4.7 /100 | #219 | Tragic 17.7% |
| Immigrants | Panama | 4.1 /100 | #220 | Tragic 17.7% |
| Cubans | 3.7 /100 | #221 | Tragic 17.8% |
| Immigrants | Armenia | 3.6 /100 | #222 | Tragic 17.8% |
| Immigrants | Cambodia | 3.3 /100 | #223 | Tragic 17.8% |
| Osage | 3.1 /100 | #224 | Tragic 17.9% |
| Immigrants | Nonimmigrants | 2.7 /100 | #225 | Tragic 17.9% |
Demographics Similar to Immigrants from Netherlands by Child Poverty Under the Age of 16
In terms of child poverty under the age of 16, the demographic groups most similar to Immigrants from Netherlands are Immigrants from Poland (14.3%, a difference of 0.0%), Immigrants from Bulgaria (14.3%, a difference of 0.10%), Laotian (14.3%, a difference of 0.18%), Cambodian (14.4%, a difference of 0.23%), and European (14.3%, a difference of 0.28%).
| Demographics | Rating | Rank | Child Poverty Under the Age of 16 |
| Immigrants | Europe | 98.4 /100 | #63 | Exceptional 14.2% |
| Immigrants | Romania | 98.3 /100 | #64 | Exceptional 14.2% |
| Immigrants | Philippines | 98.2 /100 | #65 | Exceptional 14.3% |
| Slovenes | 98.1 /100 | #66 | Exceptional 14.3% |
| Europeans | 98.1 /100 | #67 | Exceptional 14.3% |
| Laotians | 98.0 /100 | #68 | Exceptional 14.3% |
| Immigrants | Bulgaria | 98.0 /100 | #69 | Exceptional 14.3% |
| Immigrants | Netherlands | 97.9 /100 | #70 | Exceptional 14.3% |
| Immigrants | Poland | 97.9 /100 | #71 | Exceptional 14.3% |
| Cambodians | 97.8 /100 | #72 | Exceptional 14.4% |
| Immigrants | Turkey | 97.6 /100 | #73 | Exceptional 14.4% |
| Macedonians | 97.6 /100 | #74 | Exceptional 14.4% |
| Ukrainians | 97.5 /100 | #75 | Exceptional 14.4% |
| Immigrants | Eastern Europe | 97.5 /100 | #76 | Exceptional 14.4% |
| Australians | 97.5 /100 | #77 | Exceptional 14.4% |