Immigrants from Dominican Republic vs Alaska Native Child Poverty Under the Age of 16
COMPARE
Immigrants from Dominican Republic
Alaska Native
Child Poverty Under the Age of 16
Child Poverty Under the Age of 16 Comparison
Immigrants from Dominican Republic
Alaska Natives
24.0%
CHILD POVERTY UNDER THE AGE OF 16
0.0/ 100
METRIC RATING
333rd/ 347
METRIC RANK
17.2%
CHILD POVERTY UNDER THE AGE OF 16
11.8/ 100
METRIC RATING
206th/ 347
METRIC RANK
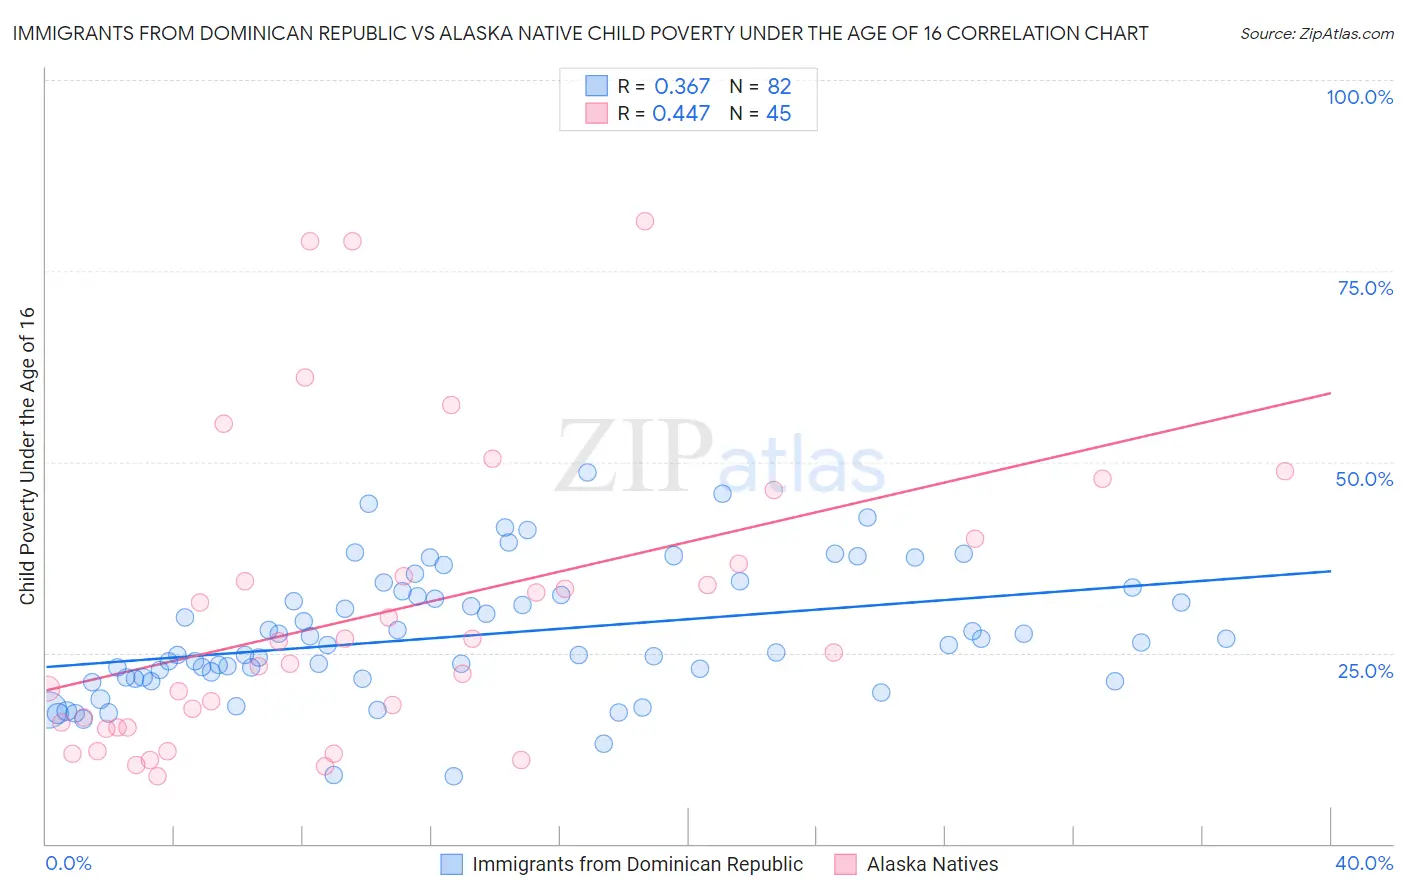
Immigrants from Dominican Republic vs Alaska Native Child Poverty Under the Age of 16 Correlation Chart
The statistical analysis conducted on geographies consisting of 273,209,047 people shows a mild positive correlation between the proportion of Immigrants from Dominican Republic and poverty level among children under the age of 16 in the United States with a correlation coefficient (R) of 0.367 and weighted average of 24.0%. Similarly, the statistical analysis conducted on geographies consisting of 76,612,165 people shows a moderate positive correlation between the proportion of Alaska Natives and poverty level among children under the age of 16 in the United States with a correlation coefficient (R) of 0.447 and weighted average of 17.2%, a difference of 39.5%.
Child Poverty Under the Age of 16 Correlation Summary
| Measurement | Immigrants from Dominican Republic | Alaska Native |
| Minimum | 8.8% | 8.9% |
| Maximum | 48.5% | 81.6% |
| Range | 39.7% | 72.7% |
| Mean | 27.3% | 30.2% |
| Median | 26.0% | 25.0% |
| Interquartile 25% (IQ1) | 21.7% | 15.2% |
| Interquartile 75% (IQ3) | 32.6% | 38.3% |
| Interquartile Range (IQR) | 10.8% | 23.1% |
| Standard Deviation (Sample) | 8.3% | 19.4% |
| Standard Deviation (Population) | 8.3% | 19.1% |
Similar Demographics by Child Poverty Under the Age of 16
Demographics Similar to Immigrants from Dominican Republic by Child Poverty Under the Age of 16
In terms of child poverty under the age of 16, the demographic groups most similar to Immigrants from Dominican Republic are Pueblo (23.9%, a difference of 0.17%), Apache (23.8%, a difference of 0.55%), Native/Alaskan (23.8%, a difference of 0.78%), Dominican (23.8%, a difference of 0.87%), and Black/African American (24.4%, a difference of 2.0%).
| Demographics | Rating | Rank | Child Poverty Under the Age of 16 |
| Immigrants | Honduras | 0.0 /100 | #326 | Tragic 22.7% |
| Menominee | 0.0 /100 | #327 | Tragic 23.0% |
| Colville | 0.0 /100 | #328 | Tragic 23.0% |
| Dominicans | 0.0 /100 | #329 | Tragic 23.8% |
| Natives/Alaskans | 0.0 /100 | #330 | Tragic 23.8% |
| Apache | 0.0 /100 | #331 | Tragic 23.8% |
| Pueblo | 0.0 /100 | #332 | Tragic 23.9% |
| Immigrants | Dominican Republic | 0.0 /100 | #333 | Tragic 24.0% |
| Blacks/African Americans | 0.0 /100 | #334 | Tragic 24.4% |
| Houma | 0.0 /100 | #335 | Tragic 24.9% |
| Yup'ik | 0.0 /100 | #336 | Tragic 25.1% |
| Sioux | 0.0 /100 | #337 | Tragic 25.2% |
| Cheyenne | 0.0 /100 | #338 | Tragic 25.4% |
| Crow | 0.0 /100 | #339 | Tragic 26.0% |
| Hopi | 0.0 /100 | #340 | Tragic 27.1% |
Demographics Similar to Alaska Natives by Child Poverty Under the Age of 16
In terms of child poverty under the age of 16, the demographic groups most similar to Alaska Natives are Aleut (17.1%, a difference of 0.54%), Hmong (17.1%, a difference of 0.55%), Immigrants from Sierra Leone (17.1%, a difference of 0.61%), Ugandan (17.1%, a difference of 0.63%), and Immigrants from Uzbekistan (17.1%, a difference of 0.71%).
| Demographics | Rating | Rank | Child Poverty Under the Age of 16 |
| Immigrants | Afghanistan | 15.1 /100 | #199 | Poor 17.0% |
| Immigrants | Cameroon | 14.7 /100 | #200 | Poor 17.1% |
| Immigrants | Uzbekistan | 14.7 /100 | #201 | Poor 17.1% |
| Ugandans | 14.3 /100 | #202 | Poor 17.1% |
| Immigrants | Sierra Leone | 14.2 /100 | #203 | Poor 17.1% |
| Hmong | 14.0 /100 | #204 | Poor 17.1% |
| Aleuts | 13.9 /100 | #205 | Poor 17.1% |
| Alaska Natives | 11.8 /100 | #206 | Poor 17.2% |
| German Russians | 8.6 /100 | #207 | Tragic 17.4% |
| Pennsylvania Germans | 7.5 /100 | #208 | Tragic 17.4% |
| Panamanians | 6.9 /100 | #209 | Tragic 17.5% |
| Alaskan Athabascans | 6.9 /100 | #210 | Tragic 17.5% |
| Immigrants | Thailand | 6.6 /100 | #211 | Tragic 17.5% |
| Immigrants | Immigrants | 6.5 /100 | #212 | Tragic 17.5% |
| Immigrants | Azores | 6.2 /100 | #213 | Tragic 17.5% |