Immigrants from Bulgaria vs Immigrants from Netherlands Child Poverty Under the Age of 16
COMPARE
Immigrants from Bulgaria
Immigrants from Netherlands
Child Poverty Under the Age of 16
Child Poverty Under the Age of 16 Comparison
Immigrants from Bulgaria
Immigrants from Netherlands
14.3%
CHILD POVERTY UNDER THE AGE OF 16
98.0/ 100
METRIC RATING
69th/ 347
METRIC RANK
14.3%
CHILD POVERTY UNDER THE AGE OF 16
97.9/ 100
METRIC RATING
70th/ 347
METRIC RANK
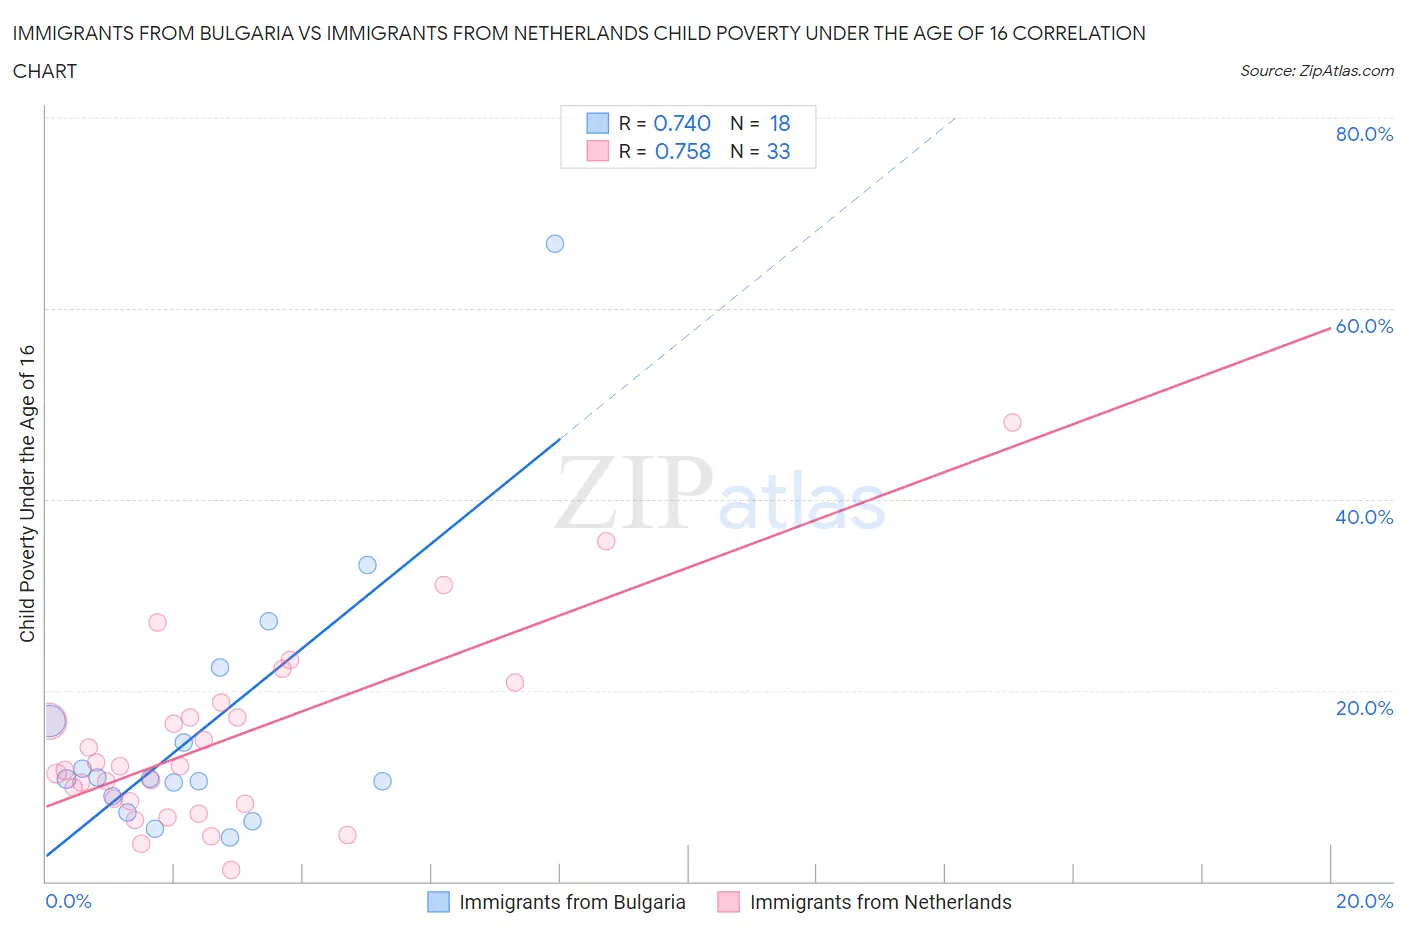
Immigrants from Bulgaria vs Immigrants from Netherlands Child Poverty Under the Age of 16 Correlation Chart
The statistical analysis conducted on geographies consisting of 171,715,259 people shows a strong positive correlation between the proportion of Immigrants from Bulgaria and poverty level among children under the age of 16 in the United States with a correlation coefficient (R) of 0.740 and weighted average of 14.3%. Similarly, the statistical analysis conducted on geographies consisting of 236,076,675 people shows a strong positive correlation between the proportion of Immigrants from Netherlands and poverty level among children under the age of 16 in the United States with a correlation coefficient (R) of 0.758 and weighted average of 14.3%, a difference of 0.10%.
Child Poverty Under the Age of 16 Correlation Summary
| Measurement | Immigrants from Bulgaria | Immigrants from Netherlands |
| Minimum | 4.6% | 1.1% |
| Maximum | 66.8% | 48.1% |
| Range | 62.2% | 46.9% |
| Mean | 16.1% | 14.7% |
| Median | 10.8% | 12.0% |
| Interquartile 25% (IQ1) | 8.9% | 8.3% |
| Interquartile 75% (IQ3) | 16.8% | 17.9% |
| Interquartile Range (IQR) | 7.9% | 9.6% |
| Standard Deviation (Sample) | 14.7% | 9.8% |
| Standard Deviation (Population) | 14.3% | 9.7% |
Demographics Similar to Immigrants from Bulgaria and Immigrants from Netherlands by Child Poverty Under the Age of 16
In terms of child poverty under the age of 16, the demographic groups most similar to Immigrants from Bulgaria are Laotian (14.3%, a difference of 0.080%), Immigrants from Poland (14.3%, a difference of 0.11%), European (14.3%, a difference of 0.18%), Slovene (14.3%, a difference of 0.21%), and Cambodian (14.4%, a difference of 0.33%). Similarly, the demographic groups most similar to Immigrants from Netherlands are Immigrants from Poland (14.3%, a difference of 0.0%), Laotian (14.3%, a difference of 0.18%), Cambodian (14.4%, a difference of 0.23%), European (14.3%, a difference of 0.28%), and Slovene (14.3%, a difference of 0.31%).
| Demographics | Rating | Rank | Child Poverty Under the Age of 16 |
| Scandinavians | 98.6 /100 | #59 | Exceptional 14.1% |
| Immigrants | Austria | 98.5 /100 | #60 | Exceptional 14.2% |
| Immigrants | Sweden | 98.5 /100 | #61 | Exceptional 14.2% |
| Zimbabweans | 98.5 /100 | #62 | Exceptional 14.2% |
| Immigrants | Europe | 98.4 /100 | #63 | Exceptional 14.2% |
| Immigrants | Romania | 98.3 /100 | #64 | Exceptional 14.2% |
| Immigrants | Philippines | 98.2 /100 | #65 | Exceptional 14.3% |
| Slovenes | 98.1 /100 | #66 | Exceptional 14.3% |
| Europeans | 98.1 /100 | #67 | Exceptional 14.3% |
| Laotians | 98.0 /100 | #68 | Exceptional 14.3% |
| Immigrants | Bulgaria | 98.0 /100 | #69 | Exceptional 14.3% |
| Immigrants | Netherlands | 97.9 /100 | #70 | Exceptional 14.3% |
| Immigrants | Poland | 97.9 /100 | #71 | Exceptional 14.3% |
| Cambodians | 97.8 /100 | #72 | Exceptional 14.4% |
| Immigrants | Turkey | 97.6 /100 | #73 | Exceptional 14.4% |
| Macedonians | 97.6 /100 | #74 | Exceptional 14.4% |
| Ukrainians | 97.5 /100 | #75 | Exceptional 14.4% |
| Immigrants | Eastern Europe | 97.5 /100 | #76 | Exceptional 14.4% |
| Australians | 97.5 /100 | #77 | Exceptional 14.4% |
| Immigrants | Russia | 97.3 /100 | #78 | Exceptional 14.5% |
| Swiss | 97.3 /100 | #79 | Exceptional 14.5% |