Immigrants from Czechoslovakia vs Puget Sound Salish Seniors Poverty Over the Age of 75
COMPARE
Immigrants from Czechoslovakia
Puget Sound Salish
Seniors Poverty Over the Age of 75
Seniors Poverty Over the Age of 75 Comparison
Immigrants from Czechoslovakia
Puget Sound Salish
11.7%
SENIORS POVERTY OVER THE AGE OF 75
87.0/ 100
METRIC RATING
113th/ 347
METRIC RANK
10.8%
SENIORS POVERTY OVER THE AGE OF 75
99.7/ 100
METRIC RATING
33rd/ 347
METRIC RANK
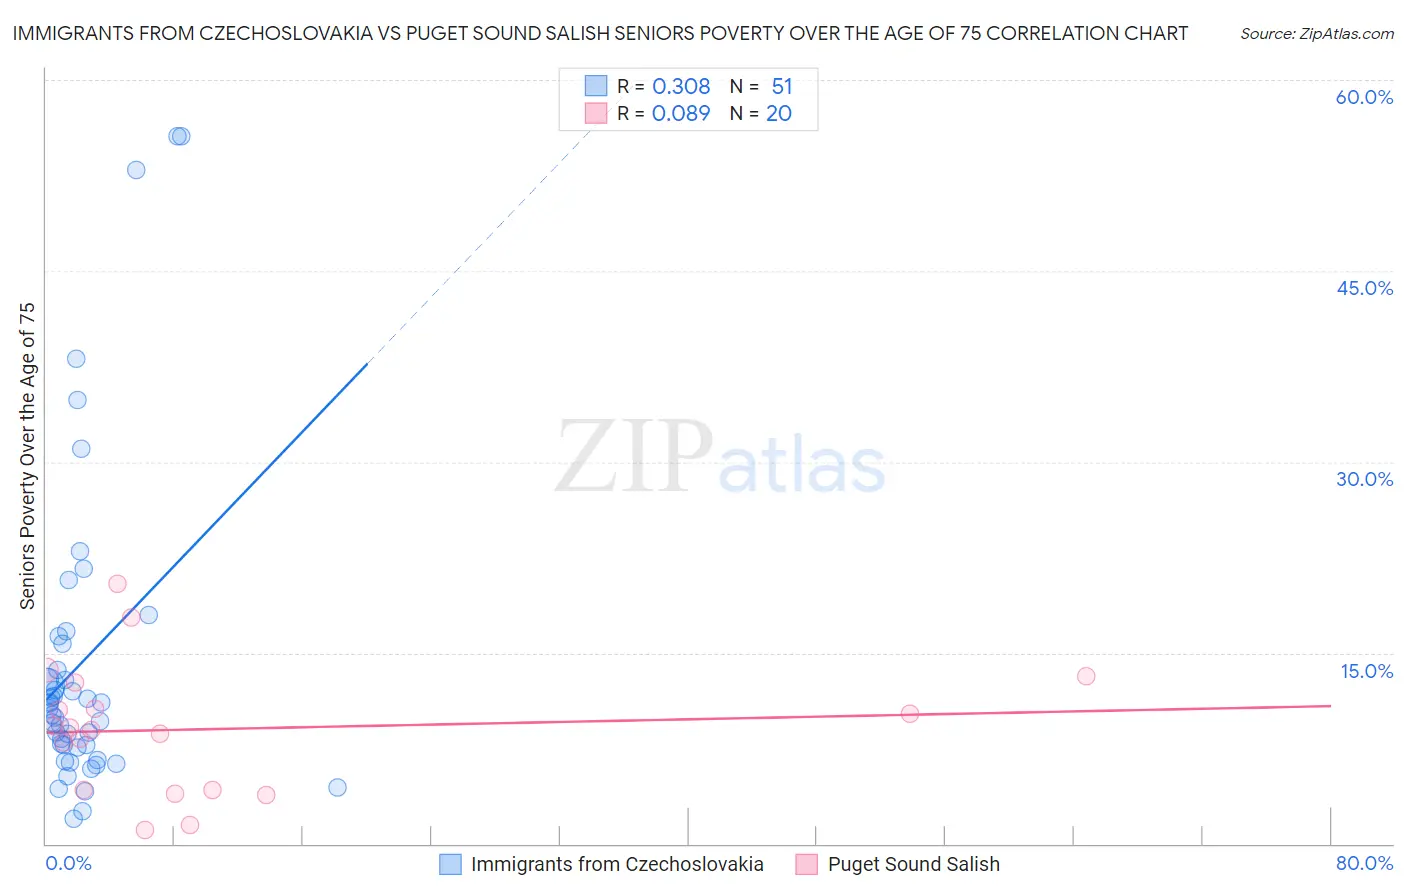
Immigrants from Czechoslovakia vs Puget Sound Salish Seniors Poverty Over the Age of 75 Correlation Chart
The statistical analysis conducted on geographies consisting of 194,223,465 people shows a mild positive correlation between the proportion of Immigrants from Czechoslovakia and poverty level among seniors over the age of 75 in the United States with a correlation coefficient (R) of 0.308 and weighted average of 11.7%. Similarly, the statistical analysis conducted on geographies consisting of 45,967,843 people shows a slight positive correlation between the proportion of Puget Sound Salish and poverty level among seniors over the age of 75 in the United States with a correlation coefficient (R) of 0.089 and weighted average of 10.8%, a difference of 9.0%.
Seniors Poverty Over the Age of 75 Correlation Summary
| Measurement | Immigrants from Czechoslovakia | Puget Sound Salish |
| Minimum | 1.9% | 1.0% |
| Maximum | 55.6% | 20.4% |
| Range | 53.6% | 19.4% |
| Mean | 14.3% | 9.0% |
| Median | 10.6% | 9.1% |
| Interquartile 25% (IQ1) | 7.6% | 4.2% |
| Interquartile 75% (IQ3) | 15.7% | 11.7% |
| Interquartile Range (IQR) | 8.2% | 7.4% |
| Standard Deviation (Sample) | 12.6% | 5.1% |
| Standard Deviation (Population) | 12.5% | 4.9% |
Similar Demographics by Seniors Poverty Over the Age of 75
Demographics Similar to Immigrants from Czechoslovakia by Seniors Poverty Over the Age of 75
In terms of seniors poverty over the age of 75, the demographic groups most similar to Immigrants from Czechoslovakia are Ukrainian (11.7%, a difference of 0.010%), New Zealander (11.7%, a difference of 0.11%), Iraqi (11.7%, a difference of 0.11%), Icelander (11.7%, a difference of 0.22%), and Immigrants from Zimbabwe (11.7%, a difference of 0.26%).
| Demographics | Rating | Rank | Seniors Poverty Over the Age of 75 |
| Russians | 89.9 /100 | #106 | Excellent 11.6% |
| Immigrants | Oceania | 89.4 /100 | #107 | Excellent 11.7% |
| Turks | 89.4 /100 | #108 | Excellent 11.7% |
| South Africans | 89.3 /100 | #109 | Excellent 11.7% |
| Immigrants | Jordan | 88.7 /100 | #110 | Excellent 11.7% |
| Burmese | 88.7 /100 | #111 | Excellent 11.7% |
| Immigrants | Bolivia | 88.4 /100 | #112 | Excellent 11.7% |
| Immigrants | Czechoslovakia | 87.0 /100 | #113 | Excellent 11.7% |
| Ukrainians | 86.9 /100 | #114 | Excellent 11.7% |
| New Zealanders | 86.3 /100 | #115 | Excellent 11.7% |
| Iraqis | 86.3 /100 | #116 | Excellent 11.7% |
| Icelanders | 85.7 /100 | #117 | Excellent 11.7% |
| Immigrants | Zimbabwe | 85.5 /100 | #118 | Excellent 11.7% |
| Immigrants | Uganda | 84.8 /100 | #119 | Excellent 11.8% |
| Immigrants | Nepal | 84.5 /100 | #120 | Excellent 11.8% |
Demographics Similar to Puget Sound Salish by Seniors Poverty Over the Age of 75
In terms of seniors poverty over the age of 75, the demographic groups most similar to Puget Sound Salish are Italian (10.8%, a difference of 0.050%), British (10.7%, a difference of 0.060%), Marshallese (10.7%, a difference of 0.19%), Swiss (10.7%, a difference of 0.38%), and Luxembourger (10.8%, a difference of 0.44%).
| Demographics | Rating | Rank | Seniors Poverty Over the Age of 75 |
| Bulgarians | 99.8 /100 | #26 | Exceptional 10.7% |
| Northern Europeans | 99.8 /100 | #27 | Exceptional 10.7% |
| Irish | 99.8 /100 | #28 | Exceptional 10.7% |
| Assyrians/Chaldeans/Syriacs | 99.8 /100 | #29 | Exceptional 10.7% |
| Swiss | 99.7 /100 | #30 | Exceptional 10.7% |
| Marshallese | 99.7 /100 | #31 | Exceptional 10.7% |
| British | 99.7 /100 | #32 | Exceptional 10.7% |
| Puget Sound Salish | 99.7 /100 | #33 | Exceptional 10.8% |
| Italians | 99.7 /100 | #34 | Exceptional 10.8% |
| Luxembourgers | 99.6 /100 | #35 | Exceptional 10.8% |
| Scotch-Irish | 99.6 /100 | #36 | Exceptional 10.8% |
| Latvians | 99.6 /100 | #37 | Exceptional 10.8% |
| Finns | 99.6 /100 | #38 | Exceptional 10.8% |
| Czechoslovakians | 99.4 /100 | #39 | Exceptional 10.9% |
| Thais | 99.4 /100 | #40 | Exceptional 10.9% |