Senegalese vs Puget Sound Salish Seniors Poverty Over the Age of 75
COMPARE
Senegalese
Puget Sound Salish
Seniors Poverty Over the Age of 75
Seniors Poverty Over the Age of 75 Comparison
Senegalese
Puget Sound Salish
14.5%
SENIORS POVERTY OVER THE AGE OF 75
0.0/ 100
METRIC RATING
277th/ 347
METRIC RANK
10.8%
SENIORS POVERTY OVER THE AGE OF 75
99.7/ 100
METRIC RATING
33rd/ 347
METRIC RANK
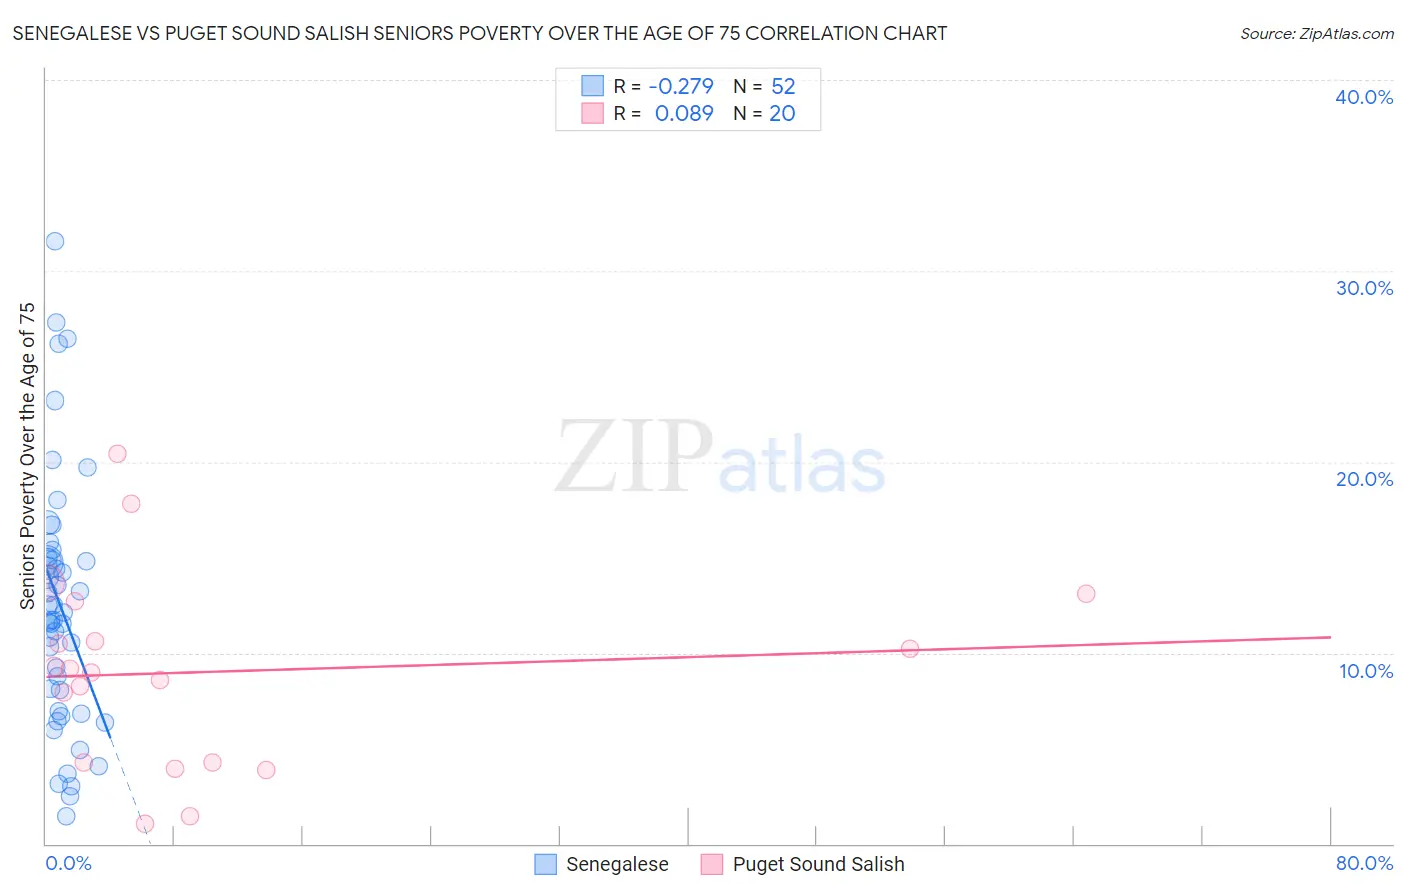
Senegalese vs Puget Sound Salish Seniors Poverty Over the Age of 75 Correlation Chart
The statistical analysis conducted on geographies consisting of 77,878,281 people shows a weak negative correlation between the proportion of Senegalese and poverty level among seniors over the age of 75 in the United States with a correlation coefficient (R) of -0.279 and weighted average of 14.5%. Similarly, the statistical analysis conducted on geographies consisting of 45,967,843 people shows a slight positive correlation between the proportion of Puget Sound Salish and poverty level among seniors over the age of 75 in the United States with a correlation coefficient (R) of 0.089 and weighted average of 10.8%, a difference of 34.9%.
Seniors Poverty Over the Age of 75 Correlation Summary
| Measurement | Senegalese | Puget Sound Salish |
| Minimum | 1.5% | 1.0% |
| Maximum | 31.6% | 20.4% |
| Range | 30.1% | 19.4% |
| Mean | 12.5% | 9.0% |
| Median | 11.9% | 9.1% |
| Interquartile 25% (IQ1) | 7.5% | 4.2% |
| Interquartile 75% (IQ3) | 14.9% | 11.7% |
| Interquartile Range (IQR) | 7.5% | 7.4% |
| Standard Deviation (Sample) | 6.6% | 5.1% |
| Standard Deviation (Population) | 6.5% | 4.9% |
Similar Demographics by Seniors Poverty Over the Age of 75
Demographics Similar to Senegalese by Seniors Poverty Over the Age of 75
In terms of seniors poverty over the age of 75, the demographic groups most similar to Senegalese are Soviet Union (14.5%, a difference of 0.27%), Immigrants from El Salvador (14.5%, a difference of 0.32%), Immigrants from Bahamas (14.4%, a difference of 0.49%), Immigrants from South America (14.4%, a difference of 0.65%), and Immigrants from Colombia (14.6%, a difference of 0.77%).
| Demographics | Rating | Rank | Seniors Poverty Over the Age of 75 |
| Immigrants | Uruguay | 0.0 /100 | #270 | Tragic 14.3% |
| Immigrants | Ghana | 0.0 /100 | #271 | Tragic 14.4% |
| Mexicans | 0.0 /100 | #272 | Tragic 14.4% |
| Immigrants | South America | 0.0 /100 | #273 | Tragic 14.4% |
| Immigrants | Bahamas | 0.0 /100 | #274 | Tragic 14.4% |
| Immigrants | El Salvador | 0.0 /100 | #275 | Tragic 14.5% |
| Soviet Union | 0.0 /100 | #276 | Tragic 14.5% |
| Senegalese | 0.0 /100 | #277 | Tragic 14.5% |
| Immigrants | Colombia | 0.0 /100 | #278 | Tragic 14.6% |
| Blacks/African Americans | 0.0 /100 | #279 | Tragic 14.6% |
| Central Americans | 0.0 /100 | #280 | Tragic 14.7% |
| Belizeans | 0.0 /100 | #281 | Tragic 14.8% |
| Immigrants | Senegal | 0.0 /100 | #282 | Tragic 14.8% |
| Guatemalans | 0.0 /100 | #283 | Tragic 14.8% |
| Cheyenne | 0.0 /100 | #284 | Tragic 14.9% |
Demographics Similar to Puget Sound Salish by Seniors Poverty Over the Age of 75
In terms of seniors poverty over the age of 75, the demographic groups most similar to Puget Sound Salish are Italian (10.8%, a difference of 0.050%), British (10.7%, a difference of 0.060%), Marshallese (10.7%, a difference of 0.19%), Swiss (10.7%, a difference of 0.38%), and Luxembourger (10.8%, a difference of 0.44%).
| Demographics | Rating | Rank | Seniors Poverty Over the Age of 75 |
| Bulgarians | 99.8 /100 | #26 | Exceptional 10.7% |
| Northern Europeans | 99.8 /100 | #27 | Exceptional 10.7% |
| Irish | 99.8 /100 | #28 | Exceptional 10.7% |
| Assyrians/Chaldeans/Syriacs | 99.8 /100 | #29 | Exceptional 10.7% |
| Swiss | 99.7 /100 | #30 | Exceptional 10.7% |
| Marshallese | 99.7 /100 | #31 | Exceptional 10.7% |
| British | 99.7 /100 | #32 | Exceptional 10.7% |
| Puget Sound Salish | 99.7 /100 | #33 | Exceptional 10.8% |
| Italians | 99.7 /100 | #34 | Exceptional 10.8% |
| Luxembourgers | 99.6 /100 | #35 | Exceptional 10.8% |
| Scotch-Irish | 99.6 /100 | #36 | Exceptional 10.8% |
| Latvians | 99.6 /100 | #37 | Exceptional 10.8% |
| Finns | 99.6 /100 | #38 | Exceptional 10.8% |
| Czechoslovakians | 99.4 /100 | #39 | Exceptional 10.9% |
| Thais | 99.4 /100 | #40 | Exceptional 10.9% |