Immigrants from Czechoslovakia vs Immigrants from South Africa Single Father Poverty
COMPARE
Immigrants from Czechoslovakia
Immigrants from South Africa
Single Father Poverty
Single Father Poverty Comparison
Immigrants from Czechoslovakia
Immigrants from South Africa
16.2%
SINGLE FATHER POVERTY
62.8/ 100
METRIC RATING
157th/ 347
METRIC RANK
16.3%
SINGLE FATHER POVERTY
44.2/ 100
METRIC RATING
177th/ 347
METRIC RANK
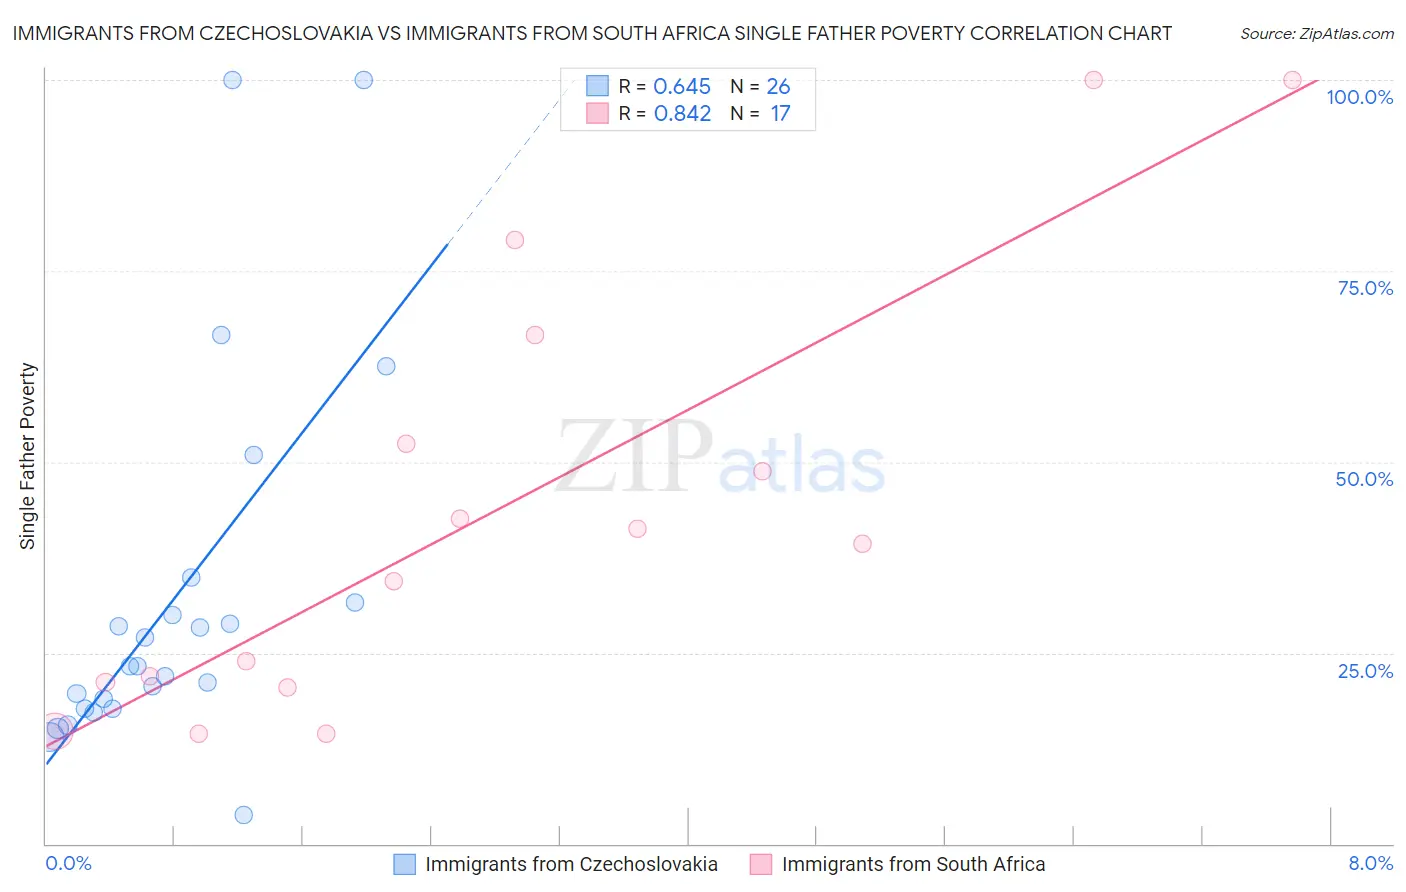
Immigrants from Czechoslovakia vs Immigrants from South Africa Single Father Poverty Correlation Chart
The statistical analysis conducted on geographies consisting of 162,409,027 people shows a significant positive correlation between the proportion of Immigrants from Czechoslovakia and poverty level among single fathers in the United States with a correlation coefficient (R) of 0.645 and weighted average of 16.2%. Similarly, the statistical analysis conducted on geographies consisting of 189,025,953 people shows a very strong positive correlation between the proportion of Immigrants from South Africa and poverty level among single fathers in the United States with a correlation coefficient (R) of 0.842 and weighted average of 16.3%, a difference of 0.84%.
Single Father Poverty Correlation Summary
| Measurement | Immigrants from Czechoslovakia | Immigrants from South Africa |
| Minimum | 3.7% | 14.4% |
| Maximum | 100.0% | 100.0% |
| Range | 96.3% | 85.6% |
| Mean | 32.3% | 43.2% |
| Median | 23.3% | 39.3% |
| Interquartile 25% (IQ1) | 17.7% | 20.8% |
| Interquartile 75% (IQ3) | 31.6% | 59.5% |
| Interquartile Range (IQR) | 14.0% | 38.7% |
| Standard Deviation (Sample) | 24.4% | 28.3% |
| Standard Deviation (Population) | 24.0% | 27.4% |
Demographics Similar to Immigrants from Czechoslovakia and Immigrants from South Africa by Single Father Poverty
In terms of single father poverty, the demographic groups most similar to Immigrants from Czechoslovakia are Portuguese (16.2%, a difference of 0.020%), Belizean (16.2%, a difference of 0.14%), Immigrants from Sudan (16.2%, a difference of 0.14%), Estonian (16.2%, a difference of 0.28%), and Ugandan (16.3%, a difference of 0.32%). Similarly, the demographic groups most similar to Immigrants from South Africa are Vietnamese (16.3%, a difference of 0.17%), Immigrants from Ecuador (16.3%, a difference of 0.24%), Immigrants from Sierra Leone (16.3%, a difference of 0.26%), Immigrants from St. Vincent and the Grenadines (16.3%, a difference of 0.26%), and Swedish (16.3%, a difference of 0.26%).
| Demographics | Rating | Rank | Single Father Poverty |
| Immigrants | Czechoslovakia | 62.8 /100 | #157 | Good 16.2% |
| Portuguese | 62.3 /100 | #158 | Good 16.2% |
| Belizeans | 59.9 /100 | #159 | Average 16.2% |
| Immigrants | Sudan | 59.8 /100 | #160 | Average 16.2% |
| Estonians | 56.7 /100 | #161 | Average 16.2% |
| Ugandans | 55.9 /100 | #162 | Average 16.3% |
| Immigrants | Costa Rica | 55.7 /100 | #163 | Average 16.3% |
| Guyanese | 55.2 /100 | #164 | Average 16.3% |
| Immigrants | Bangladesh | 55.1 /100 | #165 | Average 16.3% |
| Immigrants | Europe | 54.8 /100 | #166 | Average 16.3% |
| Yugoslavians | 53.9 /100 | #167 | Average 16.3% |
| Costa Ricans | 53.6 /100 | #168 | Average 16.3% |
| Northern Europeans | 52.8 /100 | #169 | Average 16.3% |
| Scandinavians | 52.3 /100 | #170 | Average 16.3% |
| Immigrants | Morocco | 50.7 /100 | #171 | Average 16.3% |
| Immigrants | Sierra Leone | 50.1 /100 | #172 | Average 16.3% |
| Immigrants | St. Vincent and the Grenadines | 50.0 /100 | #173 | Average 16.3% |
| Swedes | 50.0 /100 | #174 | Average 16.3% |
| Immigrants | Ecuador | 49.7 /100 | #175 | Average 16.3% |
| Vietnamese | 48.0 /100 | #176 | Average 16.3% |
| Immigrants | South Africa | 44.2 /100 | #177 | Average 16.3% |