Ecuadorian vs Immigrants from South Africa Single Father Poverty
COMPARE
Ecuadorian
Immigrants from South Africa
Single Father Poverty
Single Father Poverty Comparison
Ecuadorians
Immigrants from South Africa
16.5%
SINGLE FATHER POVERTY
24.5/ 100
METRIC RATING
193rd/ 347
METRIC RANK
16.3%
SINGLE FATHER POVERTY
44.2/ 100
METRIC RATING
177th/ 347
METRIC RANK
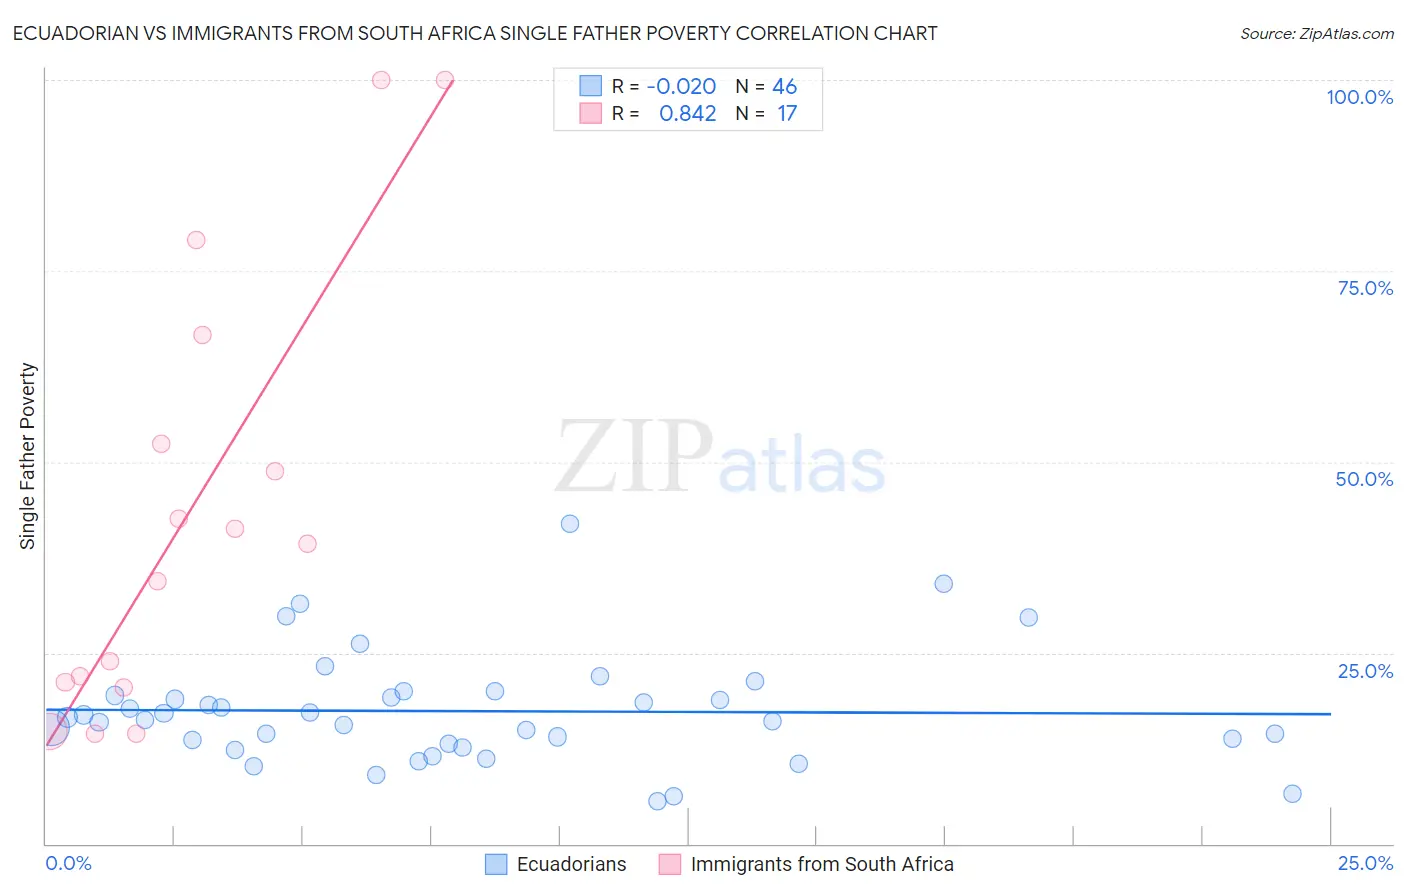
Ecuadorian vs Immigrants from South Africa Single Father Poverty Correlation Chart
The statistical analysis conducted on geographies consisting of 258,169,372 people shows no correlation between the proportion of Ecuadorians and poverty level among single fathers in the United States with a correlation coefficient (R) of -0.020 and weighted average of 16.5%. Similarly, the statistical analysis conducted on geographies consisting of 189,025,953 people shows a very strong positive correlation between the proportion of Immigrants from South Africa and poverty level among single fathers in the United States with a correlation coefficient (R) of 0.842 and weighted average of 16.3%, a difference of 0.98%.
Single Father Poverty Correlation Summary
| Measurement | Ecuadorian | Immigrants from South Africa |
| Minimum | 5.6% | 14.4% |
| Maximum | 41.9% | 100.0% |
| Range | 36.3% | 85.6% |
| Mean | 17.4% | 43.2% |
| Median | 16.4% | 39.3% |
| Interquartile 25% (IQ1) | 13.2% | 20.8% |
| Interquartile 75% (IQ3) | 19.4% | 59.5% |
| Interquartile Range (IQR) | 6.2% | 38.7% |
| Standard Deviation (Sample) | 7.2% | 28.3% |
| Standard Deviation (Population) | 7.2% | 27.4% |
Demographics Similar to Ecuadorians and Immigrants from South Africa by Single Father Poverty
In terms of single father poverty, the demographic groups most similar to Ecuadorians are Immigrants from Switzerland (16.5%, a difference of 0.010%), Cape Verdean (16.5%, a difference of 0.010%), Immigrants from Barbados (16.5%, a difference of 0.010%), Immigrants from Guyana (16.5%, a difference of 0.15%), and Immigrants from Burma/Myanmar (16.5%, a difference of 0.20%). Similarly, the demographic groups most similar to Immigrants from South Africa are Immigrants from Cuba (16.4%, a difference of 0.12%), Serbian (16.4%, a difference of 0.15%), Vietnamese (16.3%, a difference of 0.17%), Immigrants from Ecuador (16.3%, a difference of 0.24%), and Immigrants from Latin America (16.4%, a difference of 0.32%).
| Demographics | Rating | Rank | Single Father Poverty |
| Immigrants | Ecuador | 49.7 /100 | #175 | Average 16.3% |
| Vietnamese | 48.0 /100 | #176 | Average 16.3% |
| Immigrants | South Africa | 44.2 /100 | #177 | Average 16.3% |
| Immigrants | Cuba | 41.6 /100 | #178 | Average 16.4% |
| Serbians | 40.9 /100 | #179 | Average 16.4% |
| Immigrants | Latin America | 37.2 /100 | #180 | Fair 16.4% |
| Immigrants | Western Africa | 36.0 /100 | #181 | Fair 16.4% |
| Immigrants | Italy | 35.7 /100 | #182 | Fair 16.4% |
| Aleuts | 35.3 /100 | #183 | Fair 16.4% |
| Cambodians | 34.6 /100 | #184 | Fair 16.4% |
| Panamanians | 33.6 /100 | #185 | Fair 16.4% |
| Immigrants | Venezuela | 31.0 /100 | #186 | Fair 16.4% |
| Ukrainians | 30.4 /100 | #187 | Fair 16.4% |
| Russians | 30.1 /100 | #188 | Fair 16.4% |
| Latvians | 28.9 /100 | #189 | Fair 16.5% |
| Immigrants | Burma/Myanmar | 28.0 /100 | #190 | Fair 16.5% |
| Immigrants | Guyana | 27.1 /100 | #191 | Fair 16.5% |
| Immigrants | Switzerland | 24.8 /100 | #192 | Fair 16.5% |
| Ecuadorians | 24.5 /100 | #193 | Fair 16.5% |
| Cape Verdeans | 24.4 /100 | #194 | Fair 16.5% |
| Immigrants | Barbados | 24.3 /100 | #195 | Fair 16.5% |