Immigrants from Caribbean vs Hopi Child Poverty Among Boys Under 16
COMPARE
Immigrants from Caribbean
Hopi
Child Poverty Among Boys Under 16
Child Poverty Among Boys Under 16 Comparison
Immigrants from Caribbean
Hopi
21.0%
CHILD POVERTY AMONG BOYS UNDER 16
0.0/ 100
METRIC RATING
299th/ 347
METRIC RANK
25.9%
CHILD POVERTY AMONG BOYS UNDER 16
0.0/ 100
METRIC RATING
338th/ 347
METRIC RANK
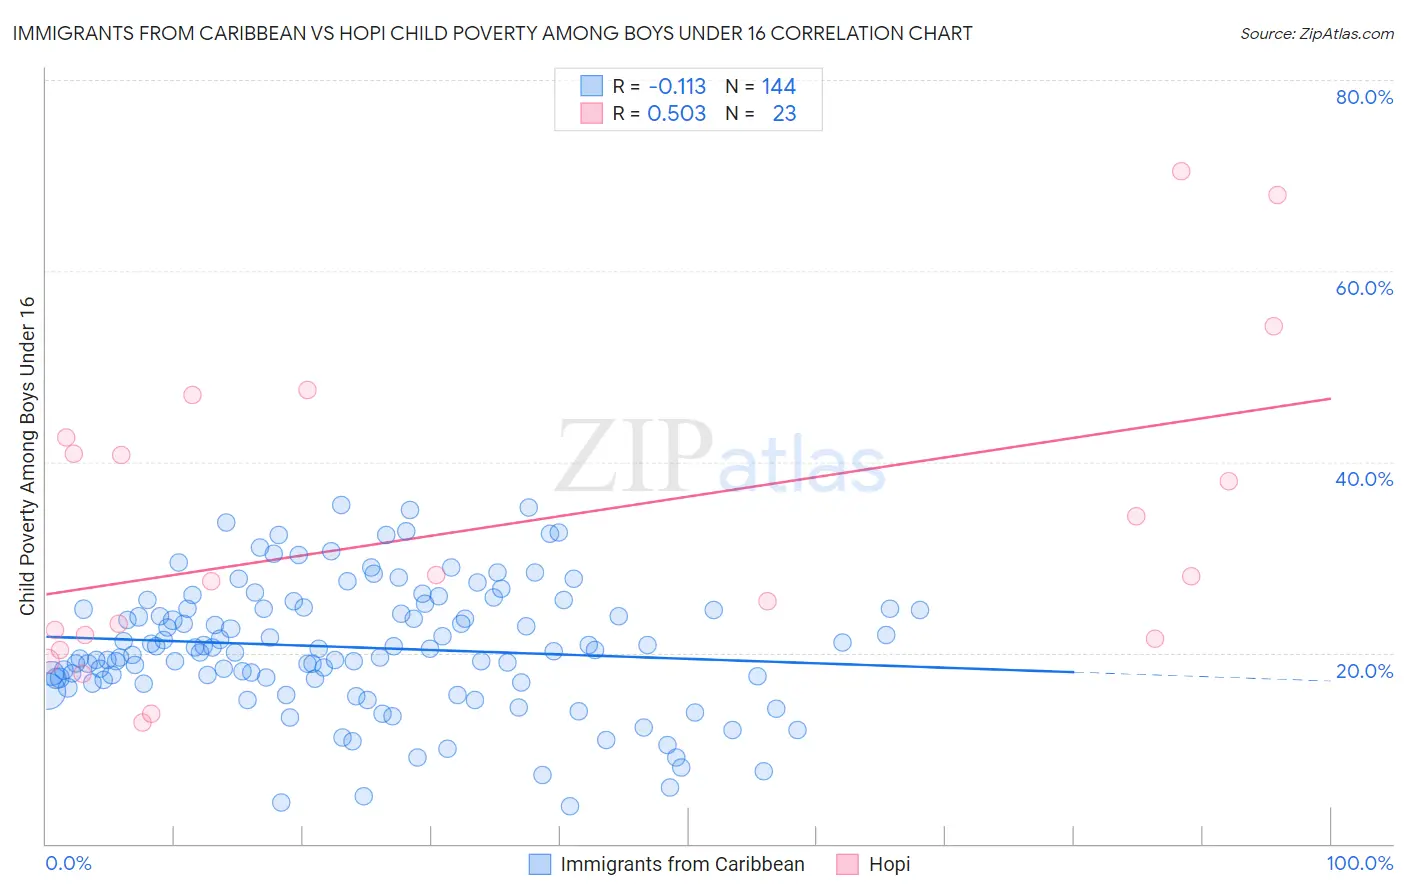
Immigrants from Caribbean vs Hopi Child Poverty Among Boys Under 16 Correlation Chart
The statistical analysis conducted on geographies consisting of 441,095,382 people shows a poor negative correlation between the proportion of Immigrants from Caribbean and poverty level among boys under the age of 16 in the United States with a correlation coefficient (R) of -0.113 and weighted average of 21.0%. Similarly, the statistical analysis conducted on geographies consisting of 74,636,845 people shows a substantial positive correlation between the proportion of Hopi and poverty level among boys under the age of 16 in the United States with a correlation coefficient (R) of 0.503 and weighted average of 25.9%, a difference of 23.4%.
Child Poverty Among Boys Under 16 Correlation Summary
| Measurement | Immigrants from Caribbean | Hopi |
| Minimum | 3.9% | 12.7% |
| Maximum | 35.5% | 70.4% |
| Range | 31.6% | 57.7% |
| Mean | 20.6% | 33.3% |
| Median | 20.4% | 28.1% |
| Interquartile 25% (IQ1) | 17.2% | 21.5% |
| Interquartile 75% (IQ3) | 24.6% | 42.6% |
| Interquartile Range (IQR) | 7.4% | 21.1% |
| Standard Deviation (Sample) | 6.6% | 16.1% |
| Standard Deviation (Population) | 6.6% | 15.7% |
Similar Demographics by Child Poverty Among Boys Under 16
Demographics Similar to Immigrants from Caribbean by Child Poverty Among Boys Under 16
In terms of child poverty among boys under 16, the demographic groups most similar to Immigrants from Caribbean are Haitian (21.0%, a difference of 0.050%), Chippewa (21.0%, a difference of 0.27%), Hispanic or Latino (20.9%, a difference of 0.53%), Guatemalan (21.1%, a difference of 0.59%), and Somali (21.1%, a difference of 0.59%).
| Demographics | Rating | Rank | Child Poverty Among Boys Under 16 |
| Yaqui | 0.0 /100 | #292 | Tragic 20.7% |
| Immigrants | Senegal | 0.0 /100 | #293 | Tragic 20.7% |
| Immigrants | Bahamas | 0.0 /100 | #294 | Tragic 20.7% |
| Mexicans | 0.0 /100 | #295 | Tragic 20.7% |
| Indonesians | 0.0 /100 | #296 | Tragic 20.8% |
| Hispanics or Latinos | 0.0 /100 | #297 | Tragic 20.9% |
| Chippewa | 0.0 /100 | #298 | Tragic 21.0% |
| Immigrants | Caribbean | 0.0 /100 | #299 | Tragic 21.0% |
| Haitians | 0.0 /100 | #300 | Tragic 21.0% |
| Guatemalans | 0.0 /100 | #301 | Tragic 21.1% |
| Somalis | 0.0 /100 | #302 | Tragic 21.1% |
| Immigrants | Haiti | 0.0 /100 | #303 | Tragic 21.3% |
| Immigrants | Central America | 0.0 /100 | #304 | Tragic 21.3% |
| Kiowa | 0.0 /100 | #305 | Tragic 21.3% |
| Immigrants | Grenada | 0.0 /100 | #306 | Tragic 21.3% |
Demographics Similar to Hopi by Child Poverty Among Boys Under 16
In terms of child poverty among boys under 16, the demographic groups most similar to Hopi are Cheyenne (25.8%, a difference of 0.51%), Houma (26.2%, a difference of 1.0%), Crow (26.3%, a difference of 1.2%), Sioux (25.3%, a difference of 2.5%), and Yup'ik (24.7%, a difference of 4.9%).
| Demographics | Rating | Rank | Child Poverty Among Boys Under 16 |
| Dominicans | 0.0 /100 | #331 | Tragic 24.2% |
| Immigrants | Dominican Republic | 0.0 /100 | #332 | Tragic 24.3% |
| Apache | 0.0 /100 | #333 | Tragic 24.5% |
| Blacks/African Americans | 0.0 /100 | #334 | Tragic 24.5% |
| Yup'ik | 0.0 /100 | #335 | Tragic 24.7% |
| Sioux | 0.0 /100 | #336 | Tragic 25.3% |
| Cheyenne | 0.0 /100 | #337 | Tragic 25.8% |
| Hopi | 0.0 /100 | #338 | Tragic 25.9% |
| Houma | 0.0 /100 | #339 | Tragic 26.2% |
| Crow | 0.0 /100 | #340 | Tragic 26.3% |
| Immigrants | Yemen | 0.0 /100 | #341 | Tragic 28.9% |
| Pima | 0.0 /100 | #342 | Tragic 29.7% |
| Navajo | 0.0 /100 | #343 | Tragic 30.3% |
| Yuman | 0.0 /100 | #344 | Tragic 30.6% |
| Tohono O'odham | 0.0 /100 | #345 | Tragic 31.6% |