Immigrants from Cuba vs Immigrants from Argentina Single Father Poverty
COMPARE
Immigrants from Cuba
Immigrants from Argentina
Single Father Poverty
Single Father Poverty Comparison
Immigrants from Cuba
Immigrants from Argentina
16.4%
SINGLE FATHER POVERTY
41.6/ 100
METRIC RATING
178th/ 347
METRIC RANK
15.8%
SINGLE FATHER POVERTY
92.8/ 100
METRIC RATING
116th/ 347
METRIC RANK
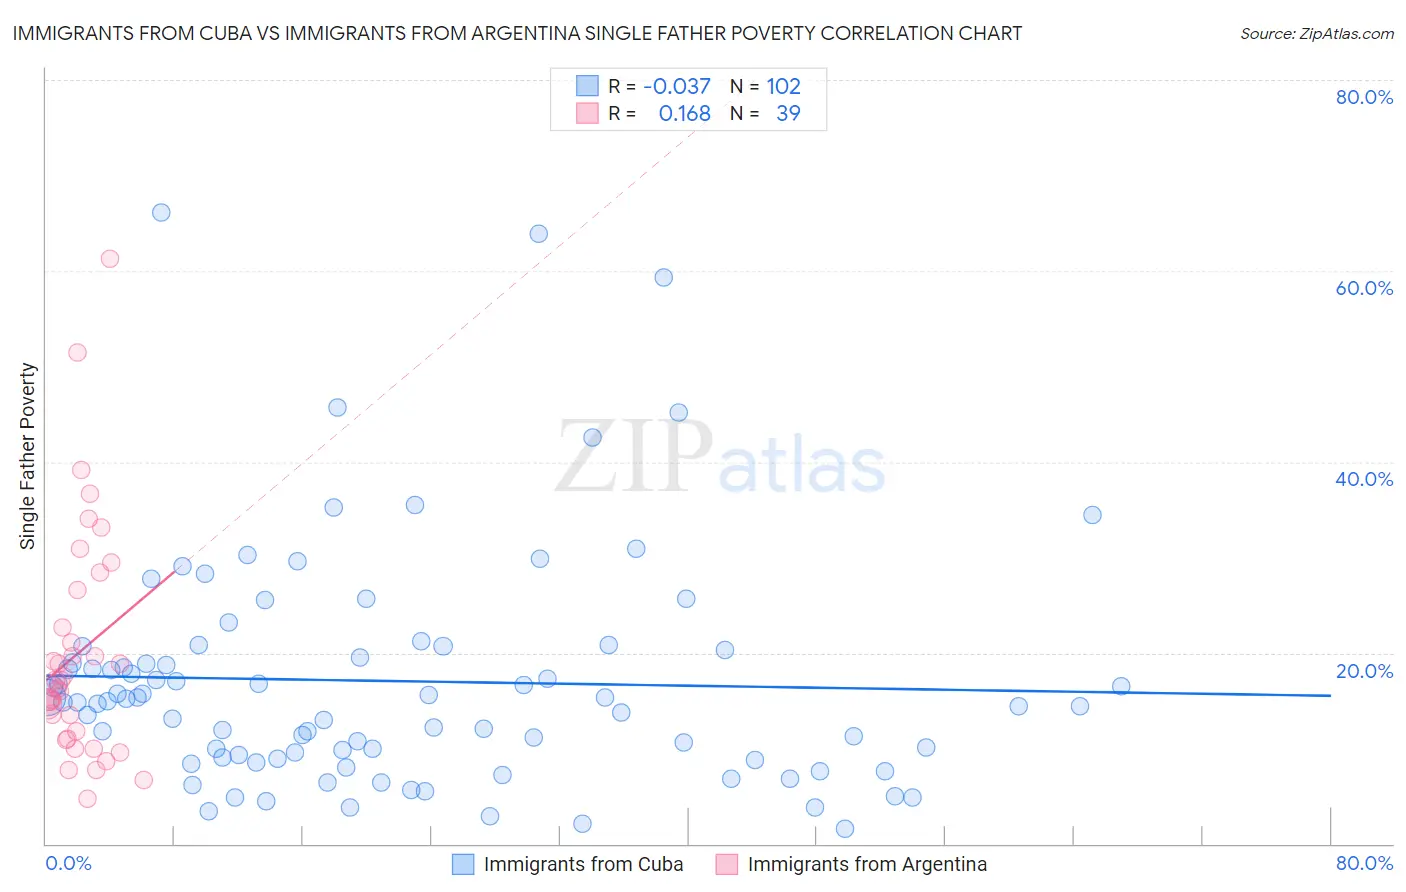
Immigrants from Cuba vs Immigrants from Argentina Single Father Poverty Correlation Chart
The statistical analysis conducted on geographies consisting of 265,819,511 people shows no correlation between the proportion of Immigrants from Cuba and poverty level among single fathers in the United States with a correlation coefficient (R) of -0.037 and weighted average of 16.4%. Similarly, the statistical analysis conducted on geographies consisting of 216,888,170 people shows a poor positive correlation between the proportion of Immigrants from Argentina and poverty level among single fathers in the United States with a correlation coefficient (R) of 0.168 and weighted average of 15.8%, a difference of 3.3%.
Single Father Poverty Correlation Summary
| Measurement | Immigrants from Cuba | Immigrants from Argentina |
| Minimum | 1.6% | 4.7% |
| Maximum | 66.1% | 61.3% |
| Range | 64.5% | 56.6% |
| Mean | 17.0% | 20.0% |
| Median | 14.9% | 17.1% |
| Interquartile 25% (IQ1) | 9.0% | 11.0% |
| Interquartile 75% (IQ3) | 20.3% | 26.6% |
| Interquartile Range (IQR) | 11.3% | 15.6% |
| Standard Deviation (Sample) | 12.2% | 12.2% |
| Standard Deviation (Population) | 12.2% | 12.1% |
Similar Demographics by Single Father Poverty
Demographics Similar to Immigrants from Cuba by Single Father Poverty
In terms of single father poverty, the demographic groups most similar to Immigrants from Cuba are Serbian (16.4%, a difference of 0.030%), Immigrants from South Africa (16.3%, a difference of 0.12%), Immigrants from Latin America (16.4%, a difference of 0.20%), Immigrants from Western Africa (16.4%, a difference of 0.26%), and Immigrants from Italy (16.4%, a difference of 0.27%).
| Demographics | Rating | Rank | Single Father Poverty |
| Immigrants | Morocco | 50.7 /100 | #171 | Average 16.3% |
| Immigrants | Sierra Leone | 50.1 /100 | #172 | Average 16.3% |
| Immigrants | St. Vincent and the Grenadines | 50.0 /100 | #173 | Average 16.3% |
| Swedes | 50.0 /100 | #174 | Average 16.3% |
| Immigrants | Ecuador | 49.7 /100 | #175 | Average 16.3% |
| Vietnamese | 48.0 /100 | #176 | Average 16.3% |
| Immigrants | South Africa | 44.2 /100 | #177 | Average 16.3% |
| Immigrants | Cuba | 41.6 /100 | #178 | Average 16.4% |
| Serbians | 40.9 /100 | #179 | Average 16.4% |
| Immigrants | Latin America | 37.2 /100 | #180 | Fair 16.4% |
| Immigrants | Western Africa | 36.0 /100 | #181 | Fair 16.4% |
| Immigrants | Italy | 35.7 /100 | #182 | Fair 16.4% |
| Aleuts | 35.3 /100 | #183 | Fair 16.4% |
| Cambodians | 34.6 /100 | #184 | Fair 16.4% |
| Panamanians | 33.6 /100 | #185 | Fair 16.4% |
Demographics Similar to Immigrants from Argentina by Single Father Poverty
In terms of single father poverty, the demographic groups most similar to Immigrants from Argentina are Immigrants from Colombia (15.8%, a difference of 0.030%), Immigrants from Eastern Europe (15.8%, a difference of 0.040%), Immigrants from Belarus (15.8%, a difference of 0.050%), Uruguayan (15.9%, a difference of 0.11%), and Immigrants (15.9%, a difference of 0.13%).
| Demographics | Rating | Rank | Single Father Poverty |
| Turks | 95.1 /100 | #109 | Exceptional 15.8% |
| Immigrants | Africa | 95.1 /100 | #110 | Exceptional 15.8% |
| Bulgarians | 94.8 /100 | #111 | Exceptional 15.8% |
| Immigrants | Latvia | 94.7 /100 | #112 | Exceptional 15.8% |
| Danes | 94.5 /100 | #113 | Exceptional 15.8% |
| Argentineans | 94.4 /100 | #114 | Exceptional 15.8% |
| Immigrants | Thailand | 93.6 /100 | #115 | Exceptional 15.8% |
| Immigrants | Argentina | 92.8 /100 | #116 | Exceptional 15.8% |
| Immigrants | Colombia | 92.6 /100 | #117 | Exceptional 15.8% |
| Immigrants | Eastern Europe | 92.5 /100 | #118 | Exceptional 15.8% |
| Immigrants | Belarus | 92.4 /100 | #119 | Exceptional 15.8% |
| Uruguayans | 92.1 /100 | #120 | Exceptional 15.9% |
| Immigrants | Immigrants | 91.9 /100 | #121 | Exceptional 15.9% |
| Sudanese | 91.6 /100 | #122 | Exceptional 15.9% |
| Palestinians | 91.3 /100 | #123 | Exceptional 15.9% |