Immigrants from Bulgaria vs Dominican Child Poverty Among Boys Under 16
COMPARE
Immigrants from Bulgaria
Dominican
Child Poverty Among Boys Under 16
Child Poverty Among Boys Under 16 Comparison
Immigrants from Bulgaria
Dominicans
14.5%
CHILD POVERTY AMONG BOYS UNDER 16
98.5/ 100
METRIC RATING
66th/ 347
METRIC RANK
24.2%
CHILD POVERTY AMONG BOYS UNDER 16
0.0/ 100
METRIC RATING
331st/ 347
METRIC RANK
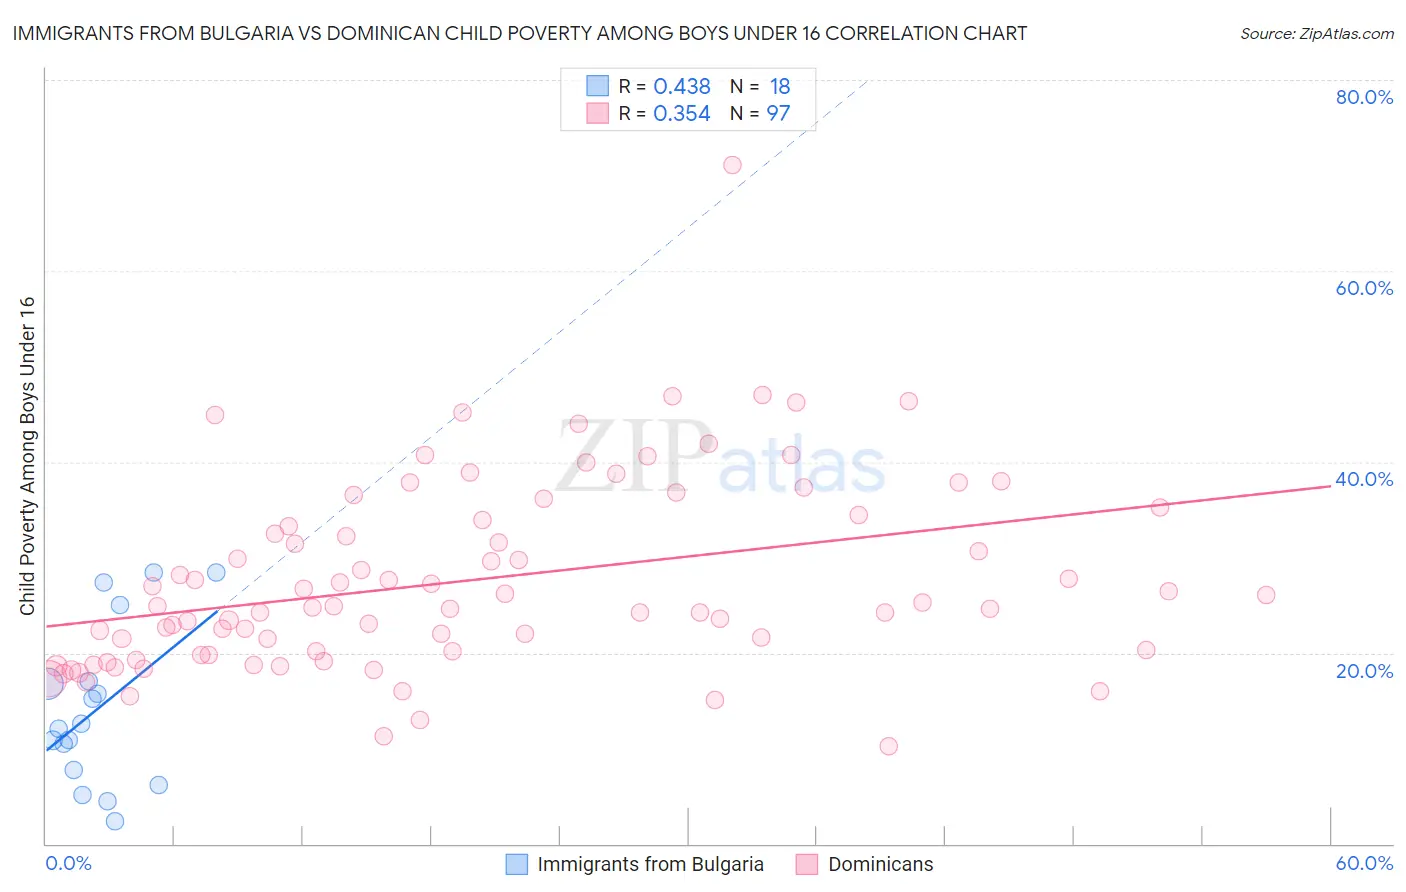
Immigrants from Bulgaria vs Dominican Child Poverty Among Boys Under 16 Correlation Chart
The statistical analysis conducted on geographies consisting of 171,062,513 people shows a moderate positive correlation between the proportion of Immigrants from Bulgaria and poverty level among boys under the age of 16 in the United States with a correlation coefficient (R) of 0.438 and weighted average of 14.5%. Similarly, the statistical analysis conducted on geographies consisting of 349,767,755 people shows a mild positive correlation between the proportion of Dominicans and poverty level among boys under the age of 16 in the United States with a correlation coefficient (R) of 0.354 and weighted average of 24.2%, a difference of 66.4%.
Child Poverty Among Boys Under 16 Correlation Summary
| Measurement | Immigrants from Bulgaria | Dominican |
| Minimum | 2.3% | 10.2% |
| Maximum | 28.5% | 71.1% |
| Range | 26.1% | 60.8% |
| Mean | 14.2% | 27.6% |
| Median | 12.3% | 24.8% |
| Interquartile 25% (IQ1) | 7.7% | 20.0% |
| Interquartile 75% (IQ3) | 17.0% | 34.2% |
| Interquartile Range (IQR) | 9.3% | 14.2% |
| Standard Deviation (Sample) | 8.3% | 10.0% |
| Standard Deviation (Population) | 8.1% | 10.0% |
Similar Demographics by Child Poverty Among Boys Under 16
Demographics Similar to Immigrants from Bulgaria by Child Poverty Among Boys Under 16
In terms of child poverty among boys under 16, the demographic groups most similar to Immigrants from Bulgaria are Soviet Union (14.5%, a difference of 0.010%), Immigrants from Europe (14.5%, a difference of 0.020%), Immigrants from Romania (14.5%, a difference of 0.030%), Slovene (14.5%, a difference of 0.11%), and Immigrants from Austria (14.5%, a difference of 0.15%).
| Demographics | Rating | Rank | Child Poverty Among Boys Under 16 |
| Immigrants | Czechoslovakia | 98.9 /100 | #59 | Exceptional 14.4% |
| Immigrants | Belgium | 98.9 /100 | #60 | Exceptional 14.4% |
| Scandinavians | 98.8 /100 | #61 | Exceptional 14.4% |
| Immigrants | Israel | 98.7 /100 | #62 | Exceptional 14.4% |
| Cambodians | 98.5 /100 | #63 | Exceptional 14.5% |
| Immigrants | Romania | 98.5 /100 | #64 | Exceptional 14.5% |
| Soviet Union | 98.5 /100 | #65 | Exceptional 14.5% |
| Immigrants | Bulgaria | 98.5 /100 | #66 | Exceptional 14.5% |
| Immigrants | Europe | 98.4 /100 | #67 | Exceptional 14.5% |
| Slovenes | 98.4 /100 | #68 | Exceptional 14.5% |
| Immigrants | Austria | 98.4 /100 | #69 | Exceptional 14.5% |
| Europeans | 98.4 /100 | #70 | Exceptional 14.5% |
| Immigrants | Netherlands | 98.1 /100 | #71 | Exceptional 14.6% |
| Immigrants | Latvia | 98.1 /100 | #72 | Exceptional 14.6% |
| Immigrants | Turkey | 98.0 /100 | #73 | Exceptional 14.6% |
Demographics Similar to Dominicans by Child Poverty Among Boys Under 16
In terms of child poverty among boys under 16, the demographic groups most similar to Dominicans are Colville (24.1%, a difference of 0.34%), Immigrants from Dominican Republic (24.3%, a difference of 0.59%), Native/Alaskan (24.0%, a difference of 0.92%), Apache (24.5%, a difference of 1.3%), and Black/African American (24.5%, a difference of 1.4%).
| Demographics | Rating | Rank | Child Poverty Among Boys Under 16 |
| Immigrants | Congo | 0.0 /100 | #324 | Tragic 22.4% |
| Central American Indians | 0.0 /100 | #325 | Tragic 22.5% |
| Paiute | 0.0 /100 | #326 | Tragic 22.8% |
| Immigrants | Honduras | 0.0 /100 | #327 | Tragic 22.8% |
| Pueblo | 0.0 /100 | #328 | Tragic 23.5% |
| Natives/Alaskans | 0.0 /100 | #329 | Tragic 24.0% |
| Colville | 0.0 /100 | #330 | Tragic 24.1% |
| Dominicans | 0.0 /100 | #331 | Tragic 24.2% |
| Immigrants | Dominican Republic | 0.0 /100 | #332 | Tragic 24.3% |
| Apache | 0.0 /100 | #333 | Tragic 24.5% |
| Blacks/African Americans | 0.0 /100 | #334 | Tragic 24.5% |
| Yup'ik | 0.0 /100 | #335 | Tragic 24.7% |
| Sioux | 0.0 /100 | #336 | Tragic 25.3% |
| Cheyenne | 0.0 /100 | #337 | Tragic 25.8% |
| Hopi | 0.0 /100 | #338 | Tragic 25.9% |