Immigrants from Congo vs West Indian Child Poverty Under the Age of 5
COMPARE
Immigrants from Congo
West Indian
Child Poverty Under the Age of 5
Child Poverty Under the Age of 5 Comparison
Immigrants from Congo
West Indians
23.9%
CHILD POVERTY UNDER THE AGE OF 5
0.0/ 100
METRIC RATING
325th/ 347
METRIC RANK
20.6%
CHILD POVERTY UNDER THE AGE OF 5
0.0/ 100
METRIC RATING
276th/ 347
METRIC RANK
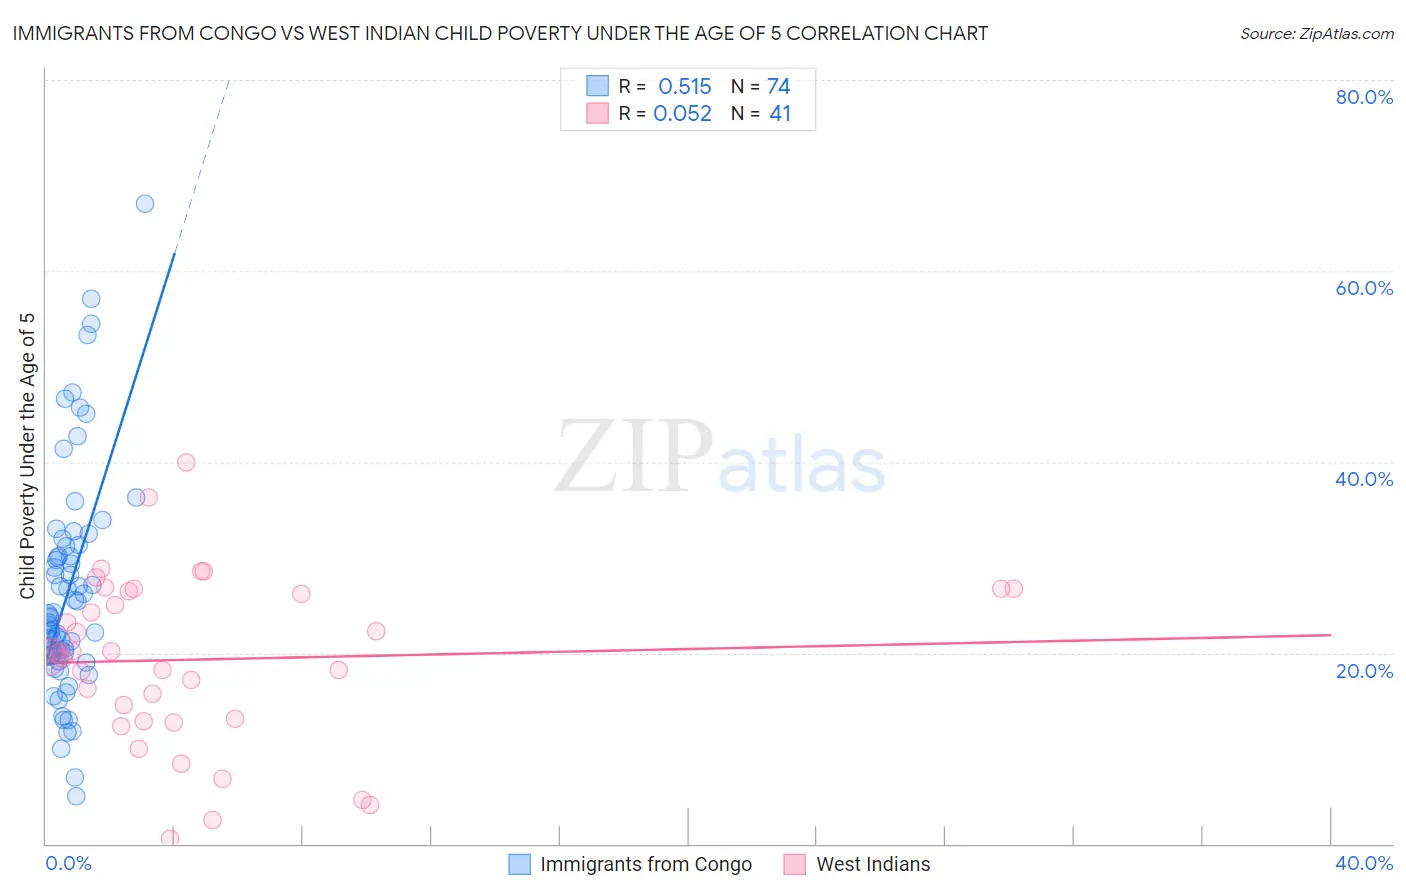
Immigrants from Congo vs West Indian Child Poverty Under the Age of 5 Correlation Chart
The statistical analysis conducted on geographies consisting of 91,481,308 people shows a substantial positive correlation between the proportion of Immigrants from Congo and poverty level among children under the age of 5 in the United States with a correlation coefficient (R) of 0.515 and weighted average of 23.9%. Similarly, the statistical analysis conducted on geographies consisting of 248,219,785 people shows a slight positive correlation between the proportion of West Indians and poverty level among children under the age of 5 in the United States with a correlation coefficient (R) of 0.052 and weighted average of 20.6%, a difference of 15.7%.
Child Poverty Under the Age of 5 Correlation Summary
| Measurement | Immigrants from Congo | West Indian |
| Minimum | 5.0% | 0.55% |
| Maximum | 67.1% | 40.0% |
| Range | 62.1% | 39.4% |
| Mean | 26.4% | 19.3% |
| Median | 23.8% | 19.9% |
| Interquartile 25% (IQ1) | 19.7% | 12.9% |
| Interquartile 75% (IQ3) | 31.1% | 26.6% |
| Interquartile Range (IQR) | 11.4% | 13.6% |
| Standard Deviation (Sample) | 11.8% | 8.9% |
| Standard Deviation (Population) | 11.7% | 8.7% |
Similar Demographics by Child Poverty Under the Age of 5
Demographics Similar to Immigrants from Congo by Child Poverty Under the Age of 5
In terms of child poverty under the age of 5, the demographic groups most similar to Immigrants from Congo are Central American Indian (23.9%, a difference of 0.18%), Paiute (23.8%, a difference of 0.21%), Dominican (24.0%, a difference of 0.64%), Immigrants from Dominican Republic (24.1%, a difference of 0.73%), and Pueblo (23.7%, a difference of 0.82%).
| Demographics | Rating | Rank | Child Poverty Under the Age of 5 |
| Dutch West Indians | 0.0 /100 | #318 | Tragic 23.3% |
| Chippewa | 0.0 /100 | #319 | Tragic 23.4% |
| Choctaw | 0.0 /100 | #320 | Tragic 23.5% |
| Immigrants | Honduras | 0.0 /100 | #321 | Tragic 23.5% |
| Ute | 0.0 /100 | #322 | Tragic 23.5% |
| Pueblo | 0.0 /100 | #323 | Tragic 23.7% |
| Paiute | 0.0 /100 | #324 | Tragic 23.8% |
| Immigrants | Congo | 0.0 /100 | #325 | Tragic 23.9% |
| Central American Indians | 0.0 /100 | #326 | Tragic 23.9% |
| Dominicans | 0.0 /100 | #327 | Tragic 24.0% |
| Immigrants | Dominican Republic | 0.0 /100 | #328 | Tragic 24.1% |
| Cajuns | 0.0 /100 | #329 | Tragic 24.1% |
| Creek | 0.0 /100 | #330 | Tragic 24.2% |
| Kiowa | 0.0 /100 | #331 | Tragic 24.5% |
| Apache | 0.0 /100 | #332 | Tragic 25.0% |
Demographics Similar to West Indians by Child Poverty Under the Age of 5
In terms of child poverty under the age of 5, the demographic groups most similar to West Indians are Bangladeshi (20.6%, a difference of 0.090%), Immigrants from Belize (20.6%, a difference of 0.14%), Immigrants from West Indies (20.7%, a difference of 0.17%), Immigrants from Grenada (20.7%, a difference of 0.19%), and Central American (20.6%, a difference of 0.24%).
| Demographics | Rating | Rank | Child Poverty Under the Age of 5 |
| Immigrants | Burma/Myanmar | 0.1 /100 | #269 | Tragic 20.4% |
| Jamaicans | 0.1 /100 | #270 | Tragic 20.4% |
| Americans | 0.1 /100 | #271 | Tragic 20.5% |
| Immigrants | Jamaica | 0.1 /100 | #272 | Tragic 20.5% |
| Central Americans | 0.1 /100 | #273 | Tragic 20.6% |
| Immigrants | Belize | 0.1 /100 | #274 | Tragic 20.6% |
| Bangladeshis | 0.1 /100 | #275 | Tragic 20.6% |
| West Indians | 0.0 /100 | #276 | Tragic 20.6% |
| Immigrants | West Indies | 0.0 /100 | #277 | Tragic 20.7% |
| Immigrants | Grenada | 0.0 /100 | #278 | Tragic 20.7% |
| Sub-Saharan Africans | 0.0 /100 | #279 | Tragic 20.8% |
| French American Indians | 0.0 /100 | #280 | Tragic 20.8% |
| Senegalese | 0.0 /100 | #281 | Tragic 20.9% |
| Potawatomi | 0.0 /100 | #282 | Tragic 21.0% |
| Comanche | 0.0 /100 | #283 | Tragic 21.0% |