Immigrants from Congo vs Thai Child Poverty Under the Age of 5
COMPARE
Immigrants from Congo
Thai
Child Poverty Under the Age of 5
Child Poverty Under the Age of 5 Comparison
Immigrants from Congo
Thais
23.9%
CHILD POVERTY UNDER THE AGE OF 5
0.0/ 100
METRIC RATING
325th/ 347
METRIC RANK
12.3%
CHILD POVERTY UNDER THE AGE OF 5
100.0/ 100
METRIC RATING
4th/ 347
METRIC RANK
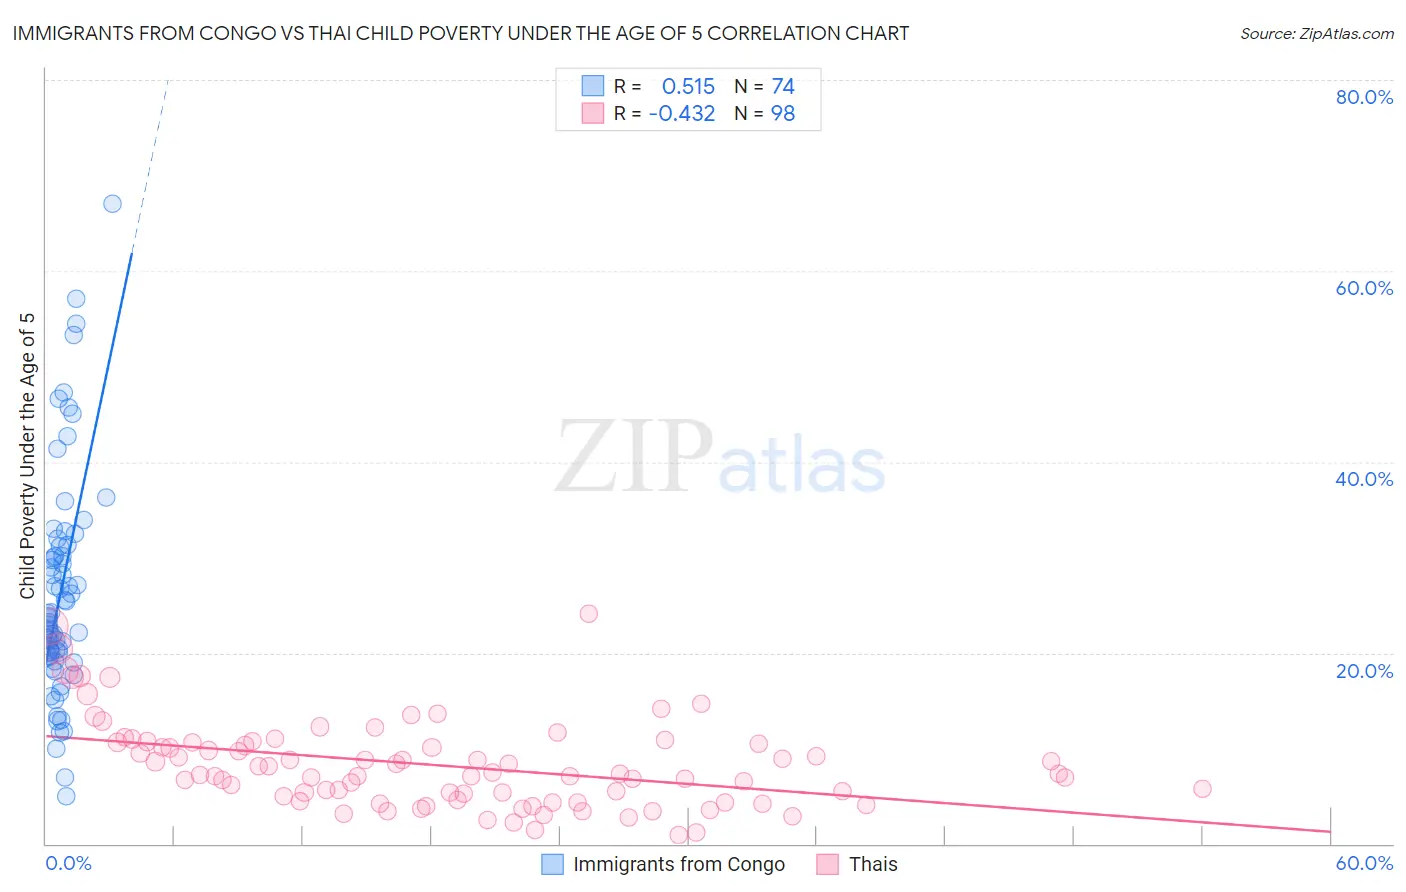
Immigrants from Congo vs Thai Child Poverty Under the Age of 5 Correlation Chart
The statistical analysis conducted on geographies consisting of 91,481,308 people shows a substantial positive correlation between the proportion of Immigrants from Congo and poverty level among children under the age of 5 in the United States with a correlation coefficient (R) of 0.515 and weighted average of 23.9%. Similarly, the statistical analysis conducted on geographies consisting of 451,866,941 people shows a moderate negative correlation between the proportion of Thais and poverty level among children under the age of 5 in the United States with a correlation coefficient (R) of -0.432 and weighted average of 12.3%, a difference of 94.1%.
Child Poverty Under the Age of 5 Correlation Summary
| Measurement | Immigrants from Congo | Thai |
| Minimum | 5.0% | 0.85% |
| Maximum | 67.1% | 24.1% |
| Range | 62.1% | 23.3% |
| Mean | 26.4% | 8.2% |
| Median | 23.8% | 7.3% |
| Interquartile 25% (IQ1) | 19.7% | 4.5% |
| Interquartile 75% (IQ3) | 31.1% | 10.6% |
| Interquartile Range (IQR) | 11.4% | 6.1% |
| Standard Deviation (Sample) | 11.8% | 4.6% |
| Standard Deviation (Population) | 11.7% | 4.6% |
Similar Demographics by Child Poverty Under the Age of 5
Demographics Similar to Immigrants from Congo by Child Poverty Under the Age of 5
In terms of child poverty under the age of 5, the demographic groups most similar to Immigrants from Congo are Central American Indian (23.9%, a difference of 0.18%), Paiute (23.8%, a difference of 0.21%), Dominican (24.0%, a difference of 0.64%), Immigrants from Dominican Republic (24.1%, a difference of 0.73%), and Pueblo (23.7%, a difference of 0.82%).
| Demographics | Rating | Rank | Child Poverty Under the Age of 5 |
| Dutch West Indians | 0.0 /100 | #318 | Tragic 23.3% |
| Chippewa | 0.0 /100 | #319 | Tragic 23.4% |
| Choctaw | 0.0 /100 | #320 | Tragic 23.5% |
| Immigrants | Honduras | 0.0 /100 | #321 | Tragic 23.5% |
| Ute | 0.0 /100 | #322 | Tragic 23.5% |
| Pueblo | 0.0 /100 | #323 | Tragic 23.7% |
| Paiute | 0.0 /100 | #324 | Tragic 23.8% |
| Immigrants | Congo | 0.0 /100 | #325 | Tragic 23.9% |
| Central American Indians | 0.0 /100 | #326 | Tragic 23.9% |
| Dominicans | 0.0 /100 | #327 | Tragic 24.0% |
| Immigrants | Dominican Republic | 0.0 /100 | #328 | Tragic 24.1% |
| Cajuns | 0.0 /100 | #329 | Tragic 24.1% |
| Creek | 0.0 /100 | #330 | Tragic 24.2% |
| Kiowa | 0.0 /100 | #331 | Tragic 24.5% |
| Apache | 0.0 /100 | #332 | Tragic 25.0% |
Demographics Similar to Thais by Child Poverty Under the Age of 5
In terms of child poverty under the age of 5, the demographic groups most similar to Thais are Immigrants from Hong Kong (12.4%, a difference of 1.0%), Immigrants from Singapore (12.9%, a difference of 5.1%), Filipino (11.6%, a difference of 6.0%), Chinese (13.1%, a difference of 6.1%), and Iranian (13.1%, a difference of 6.1%).
| Demographics | Rating | Rank | Child Poverty Under the Age of 5 |
| Immigrants | India | 100.0 /100 | #1 | Exceptional 11.5% |
| Immigrants | Taiwan | 100.0 /100 | #2 | Exceptional 11.6% |
| Filipinos | 100.0 /100 | #3 | Exceptional 11.6% |
| Thais | 100.0 /100 | #4 | Exceptional 12.3% |
| Immigrants | Hong Kong | 100.0 /100 | #5 | Exceptional 12.4% |
| Immigrants | Singapore | 100.0 /100 | #6 | Exceptional 12.9% |
| Chinese | 100.0 /100 | #7 | Exceptional 13.1% |
| Iranians | 100.0 /100 | #8 | Exceptional 13.1% |
| Immigrants | Iran | 100.0 /100 | #9 | Exceptional 13.1% |
| Burmese | 100.0 /100 | #10 | Exceptional 13.2% |
| Immigrants | Korea | 100.0 /100 | #11 | Exceptional 13.2% |
| Immigrants | South Central Asia | 100.0 /100 | #12 | Exceptional 13.3% |
| Bhutanese | 100.0 /100 | #13 | Exceptional 13.4% |
| Okinawans | 100.0 /100 | #14 | Exceptional 13.4% |
| Indians (Asian) | 100.0 /100 | #15 | Exceptional 13.4% |