Moroccan vs West Indian Child Poverty Under the Age of 5
COMPARE
Moroccan
West Indian
Child Poverty Under the Age of 5
Child Poverty Under the Age of 5 Comparison
Moroccans
West Indians
18.2%
CHILD POVERTY UNDER THE AGE OF 5
9.4/ 100
METRIC RATING
211th/ 347
METRIC RANK
20.6%
CHILD POVERTY UNDER THE AGE OF 5
0.0/ 100
METRIC RATING
276th/ 347
METRIC RANK
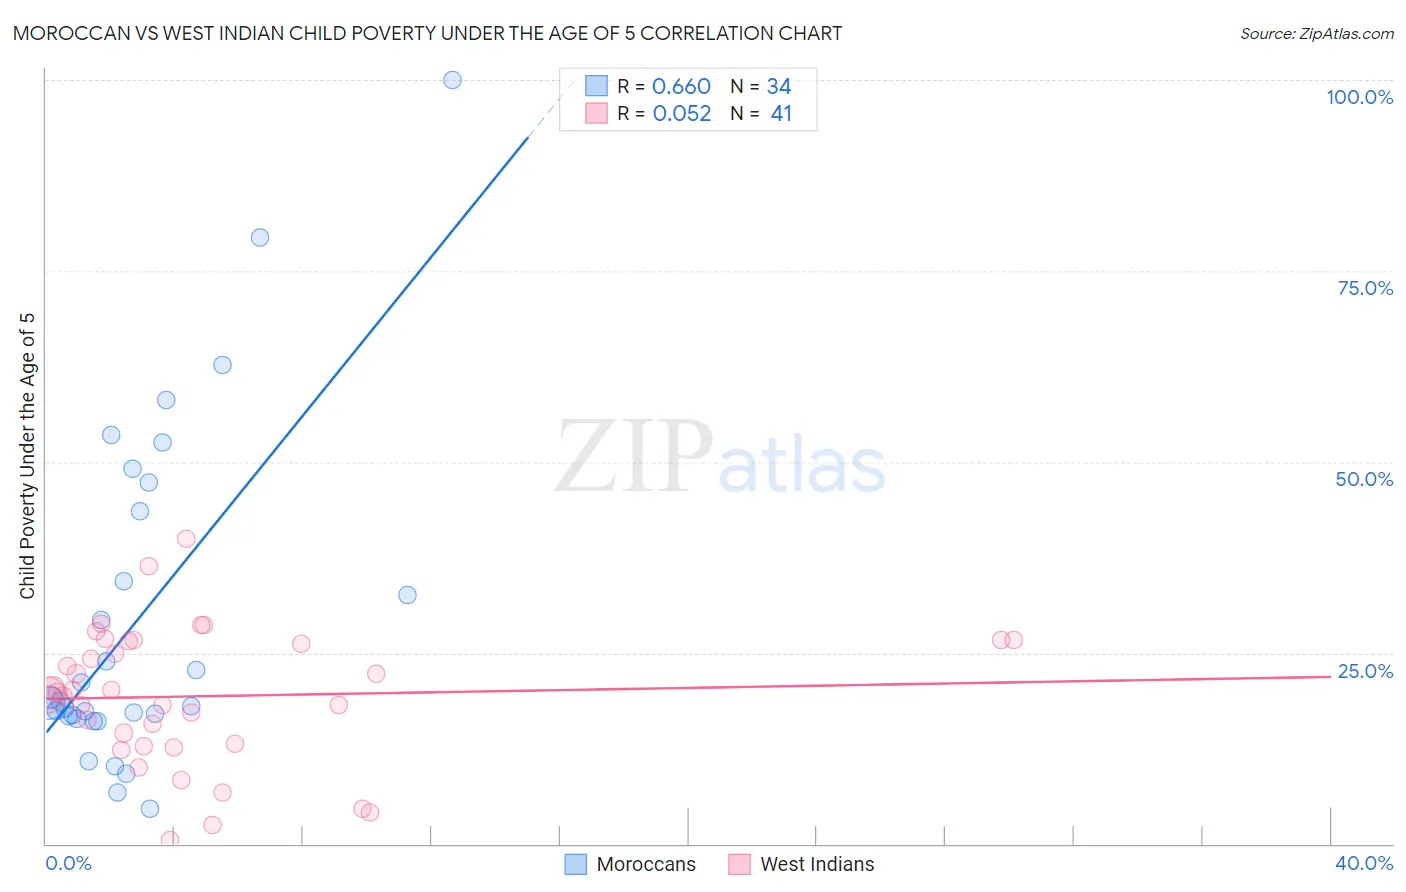
Moroccan vs West Indian Child Poverty Under the Age of 5 Correlation Chart
The statistical analysis conducted on geographies consisting of 197,569,531 people shows a significant positive correlation between the proportion of Moroccans and poverty level among children under the age of 5 in the United States with a correlation coefficient (R) of 0.660 and weighted average of 18.2%. Similarly, the statistical analysis conducted on geographies consisting of 248,219,785 people shows a slight positive correlation between the proportion of West Indians and poverty level among children under the age of 5 in the United States with a correlation coefficient (R) of 0.052 and weighted average of 20.6%, a difference of 13.2%.
Child Poverty Under the Age of 5 Correlation Summary
| Measurement | Moroccan | West Indian |
| Minimum | 4.6% | 0.55% |
| Maximum | 100.0% | 40.0% |
| Range | 95.4% | 39.4% |
| Mean | 29.3% | 19.3% |
| Median | 18.6% | 19.9% |
| Interquartile 25% (IQ1) | 16.7% | 12.9% |
| Interquartile 75% (IQ3) | 43.5% | 26.6% |
| Interquartile Range (IQR) | 26.9% | 13.6% |
| Standard Deviation (Sample) | 22.0% | 8.9% |
| Standard Deviation (Population) | 21.6% | 8.7% |
Similar Demographics by Child Poverty Under the Age of 5
Demographics Similar to Moroccans by Child Poverty Under the Age of 5
In terms of child poverty under the age of 5, the demographic groups most similar to Moroccans are Panamanian (18.2%, a difference of 0.090%), Spanish (18.2%, a difference of 0.10%), Scotch-Irish (18.2%, a difference of 0.11%), Immigrants (18.2%, a difference of 0.12%), and Nepalese (18.3%, a difference of 0.21%).
| Demographics | Rating | Rank | Child Poverty Under the Age of 5 |
| Immigrants | Eastern Africa | 13.4 /100 | #204 | Poor 18.1% |
| Spaniards | 12.8 /100 | #205 | Poor 18.1% |
| Whites/Caucasians | 12.6 /100 | #206 | Poor 18.1% |
| Immigrants | Immigrants | 9.9 /100 | #207 | Tragic 18.2% |
| Scotch-Irish | 9.8 /100 | #208 | Tragic 18.2% |
| Spanish | 9.8 /100 | #209 | Tragic 18.2% |
| Panamanians | 9.7 /100 | #210 | Tragic 18.2% |
| Moroccans | 9.4 /100 | #211 | Tragic 18.2% |
| Nepalese | 8.7 /100 | #212 | Tragic 18.3% |
| Immigrants | Thailand | 8.6 /100 | #213 | Tragic 18.3% |
| Malaysians | 6.5 /100 | #214 | Tragic 18.4% |
| Immigrants | Panama | 6.0 /100 | #215 | Tragic 18.5% |
| Hmong | 5.0 /100 | #216 | Tragic 18.5% |
| Immigrants | Africa | 4.6 /100 | #217 | Tragic 18.6% |
| Delaware | 3.4 /100 | #218 | Tragic 18.7% |
Demographics Similar to West Indians by Child Poverty Under the Age of 5
In terms of child poverty under the age of 5, the demographic groups most similar to West Indians are Bangladeshi (20.6%, a difference of 0.090%), Immigrants from Belize (20.6%, a difference of 0.14%), Immigrants from West Indies (20.7%, a difference of 0.17%), Immigrants from Grenada (20.7%, a difference of 0.19%), and Central American (20.6%, a difference of 0.24%).
| Demographics | Rating | Rank | Child Poverty Under the Age of 5 |
| Immigrants | Burma/Myanmar | 0.1 /100 | #269 | Tragic 20.4% |
| Jamaicans | 0.1 /100 | #270 | Tragic 20.4% |
| Americans | 0.1 /100 | #271 | Tragic 20.5% |
| Immigrants | Jamaica | 0.1 /100 | #272 | Tragic 20.5% |
| Central Americans | 0.1 /100 | #273 | Tragic 20.6% |
| Immigrants | Belize | 0.1 /100 | #274 | Tragic 20.6% |
| Bangladeshis | 0.1 /100 | #275 | Tragic 20.6% |
| West Indians | 0.0 /100 | #276 | Tragic 20.6% |
| Immigrants | West Indies | 0.0 /100 | #277 | Tragic 20.7% |
| Immigrants | Grenada | 0.0 /100 | #278 | Tragic 20.7% |
| Sub-Saharan Africans | 0.0 /100 | #279 | Tragic 20.8% |
| French American Indians | 0.0 /100 | #280 | Tragic 20.8% |
| Senegalese | 0.0 /100 | #281 | Tragic 20.9% |
| Potawatomi | 0.0 /100 | #282 | Tragic 21.0% |
| Comanche | 0.0 /100 | #283 | Tragic 21.0% |