New Zealander vs Immigrants from Greece Female Poverty Among 18-24 Year Olds
COMPARE
New Zealander
Immigrants from Greece
Female Poverty Among 18-24 Year Olds
Female Poverty Among 18-24 Year Olds Comparison
New Zealanders
Immigrants from Greece
21.7%
FEMALE POVERTY AMONG 18-24 YEAR OLDS
0.2/ 100
METRIC RATING
273rd/ 347
METRIC RANK
17.9%
FEMALE POVERTY AMONG 18-24 YEAR OLDS
100.0/ 100
METRIC RATING
35th/ 347
METRIC RANK
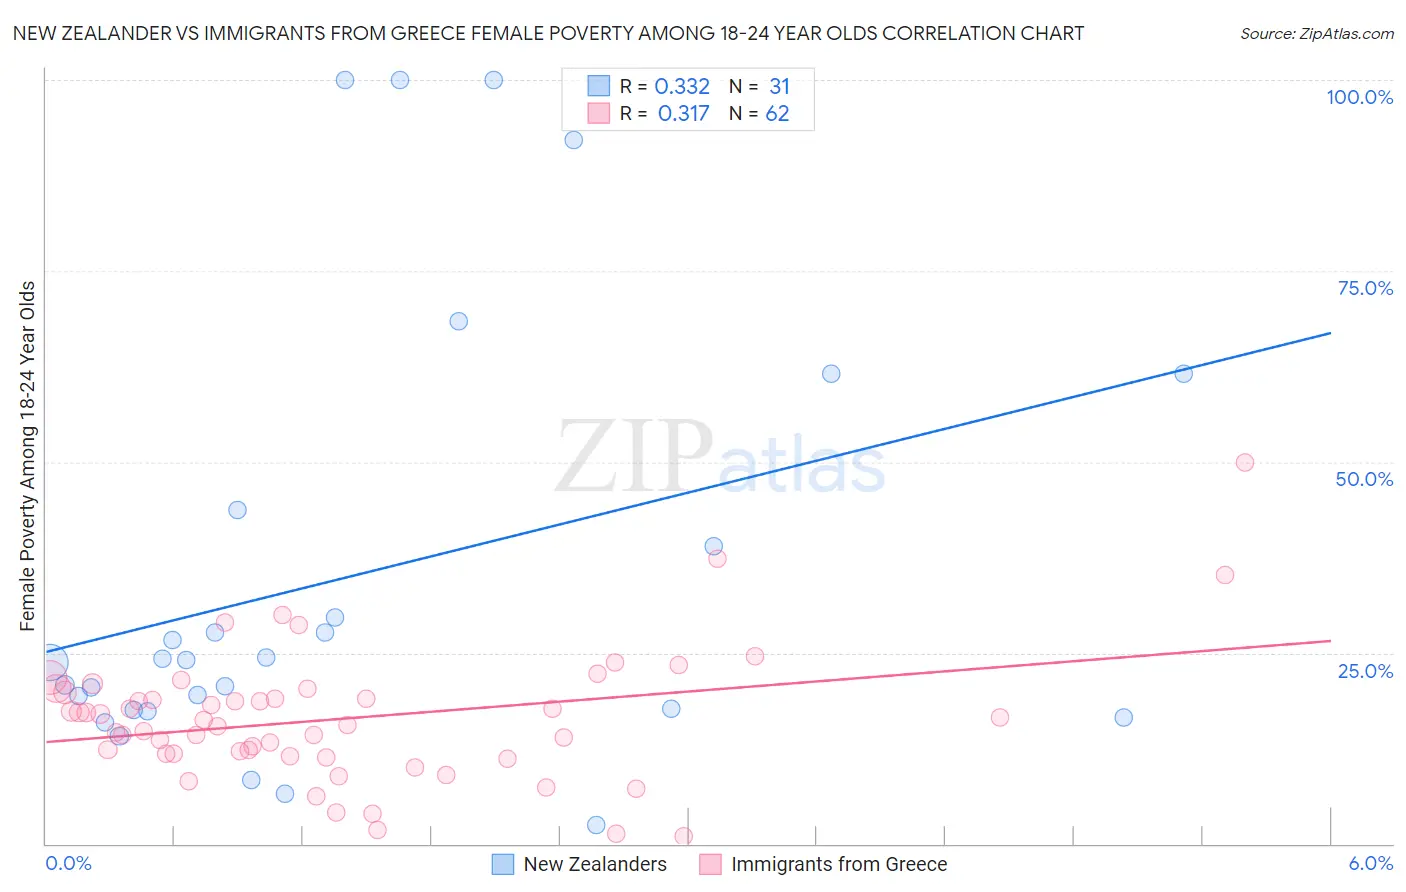
New Zealander vs Immigrants from Greece Female Poverty Among 18-24 Year Olds Correlation Chart
The statistical analysis conducted on geographies consisting of 106,255,295 people shows a mild positive correlation between the proportion of New Zealanders and poverty level among females between the ages 18 and 24 in the United States with a correlation coefficient (R) of 0.332 and weighted average of 21.7%. Similarly, the statistical analysis conducted on geographies consisting of 212,433,308 people shows a mild positive correlation between the proportion of Immigrants from Greece and poverty level among females between the ages 18 and 24 in the United States with a correlation coefficient (R) of 0.317 and weighted average of 17.9%, a difference of 21.2%.
Female Poverty Among 18-24 Year Olds Correlation Summary
| Measurement | New Zealander | Immigrants from Greece |
| Minimum | 2.5% | 0.95% |
| Maximum | 100.0% | 50.0% |
| Range | 97.5% | 49.0% |
| Mean | 35.2% | 16.4% |
| Median | 24.0% | 15.8% |
| Interquartile 25% (IQ1) | 17.5% | 11.8% |
| Interquartile 75% (IQ3) | 43.7% | 19.8% |
| Interquartile Range (IQR) | 26.2% | 8.0% |
| Standard Deviation (Sample) | 28.9% | 8.6% |
| Standard Deviation (Population) | 28.4% | 8.5% |
Similar Demographics by Female Poverty Among 18-24 Year Olds
Demographics Similar to New Zealanders by Female Poverty Among 18-24 Year Olds
In terms of female poverty among 18-24 year olds, the demographic groups most similar to New Zealanders are Basque (21.7%, a difference of 0.14%), Immigrants from Honduras (21.8%, a difference of 0.39%), Scotch-Irish (21.6%, a difference of 0.41%), Mongolian (21.6%, a difference of 0.43%), and Immigrants from Bangladesh (21.8%, a difference of 0.43%).
| Demographics | Rating | Rank | Female Poverty Among 18-24 Year Olds |
| Alaska Natives | 0.3 /100 | #266 | Tragic 21.5% |
| Americans | 0.3 /100 | #267 | Tragic 21.6% |
| Immigrants | Burma/Myanmar | 0.2 /100 | #268 | Tragic 21.6% |
| Celtics | 0.2 /100 | #269 | Tragic 21.6% |
| Mongolians | 0.2 /100 | #270 | Tragic 21.6% |
| Scotch-Irish | 0.2 /100 | #271 | Tragic 21.6% |
| Basques | 0.2 /100 | #272 | Tragic 21.7% |
| New Zealanders | 0.2 /100 | #273 | Tragic 21.7% |
| Immigrants | Honduras | 0.1 /100 | #274 | Tragic 21.8% |
| Immigrants | Bangladesh | 0.1 /100 | #275 | Tragic 21.8% |
| Bahamians | 0.1 /100 | #276 | Tragic 21.8% |
| Immigrants | Switzerland | 0.1 /100 | #277 | Tragic 21.8% |
| Yaqui | 0.1 /100 | #278 | Tragic 21.9% |
| Spanish Americans | 0.1 /100 | #279 | Tragic 21.9% |
| Immigrants | Dominica | 0.1 /100 | #280 | Tragic 21.9% |
Demographics Similar to Immigrants from Greece by Female Poverty Among 18-24 Year Olds
In terms of female poverty among 18-24 year olds, the demographic groups most similar to Immigrants from Greece are Immigrants from Nicaragua (17.9%, a difference of 0.040%), Immigrants from South America (17.9%, a difference of 0.050%), Immigrants from Croatia (17.9%, a difference of 0.11%), Native Hawaiian (17.9%, a difference of 0.15%), and Immigrants from Moldova (17.9%, a difference of 0.18%).
| Demographics | Rating | Rank | Female Poverty Among 18-24 Year Olds |
| Venezuelans | 100.0 /100 | #28 | Exceptional 17.7% |
| Portuguese | 100.0 /100 | #29 | Exceptional 17.8% |
| Immigrants | South Eastern Asia | 100.0 /100 | #30 | Exceptional 17.8% |
| Immigrants | Vietnam | 100.0 /100 | #31 | Exceptional 17.8% |
| Immigrants | Moldova | 100.0 /100 | #32 | Exceptional 17.9% |
| Native Hawaiians | 100.0 /100 | #33 | Exceptional 17.9% |
| Immigrants | Nicaragua | 100.0 /100 | #34 | Exceptional 17.9% |
| Immigrants | Greece | 100.0 /100 | #35 | Exceptional 17.9% |
| Immigrants | South America | 100.0 /100 | #36 | Exceptional 17.9% |
| Immigrants | Croatia | 100.0 /100 | #37 | Exceptional 17.9% |
| South Americans | 100.0 /100 | #38 | Exceptional 18.0% |
| Puget Sound Salish | 100.0 /100 | #39 | Exceptional 18.0% |
| Immigrants | Romania | 100.0 /100 | #40 | Exceptional 18.0% |
| Immigrants | Argentina | 100.0 /100 | #41 | Exceptional 18.0% |
| Bulgarians | 100.0 /100 | #42 | Exceptional 18.1% |