Immigrants from Poland vs Immigrants from North America Female Poverty Among 25-34 Year Olds
COMPARE
Immigrants from Poland
Immigrants from North America
Female Poverty Among 25-34 Year Olds
Female Poverty Among 25-34 Year Olds Comparison
Immigrants from Poland
Immigrants from North America
11.6%
FEMALE POVERTY AMONG 25-34 YEAR OLDS
99.9/ 100
METRIC RATING
33rd/ 347
METRIC RANK
12.9%
FEMALE POVERTY AMONG 25-34 YEAR OLDS
89.7/ 100
METRIC RATING
129th/ 347
METRIC RANK
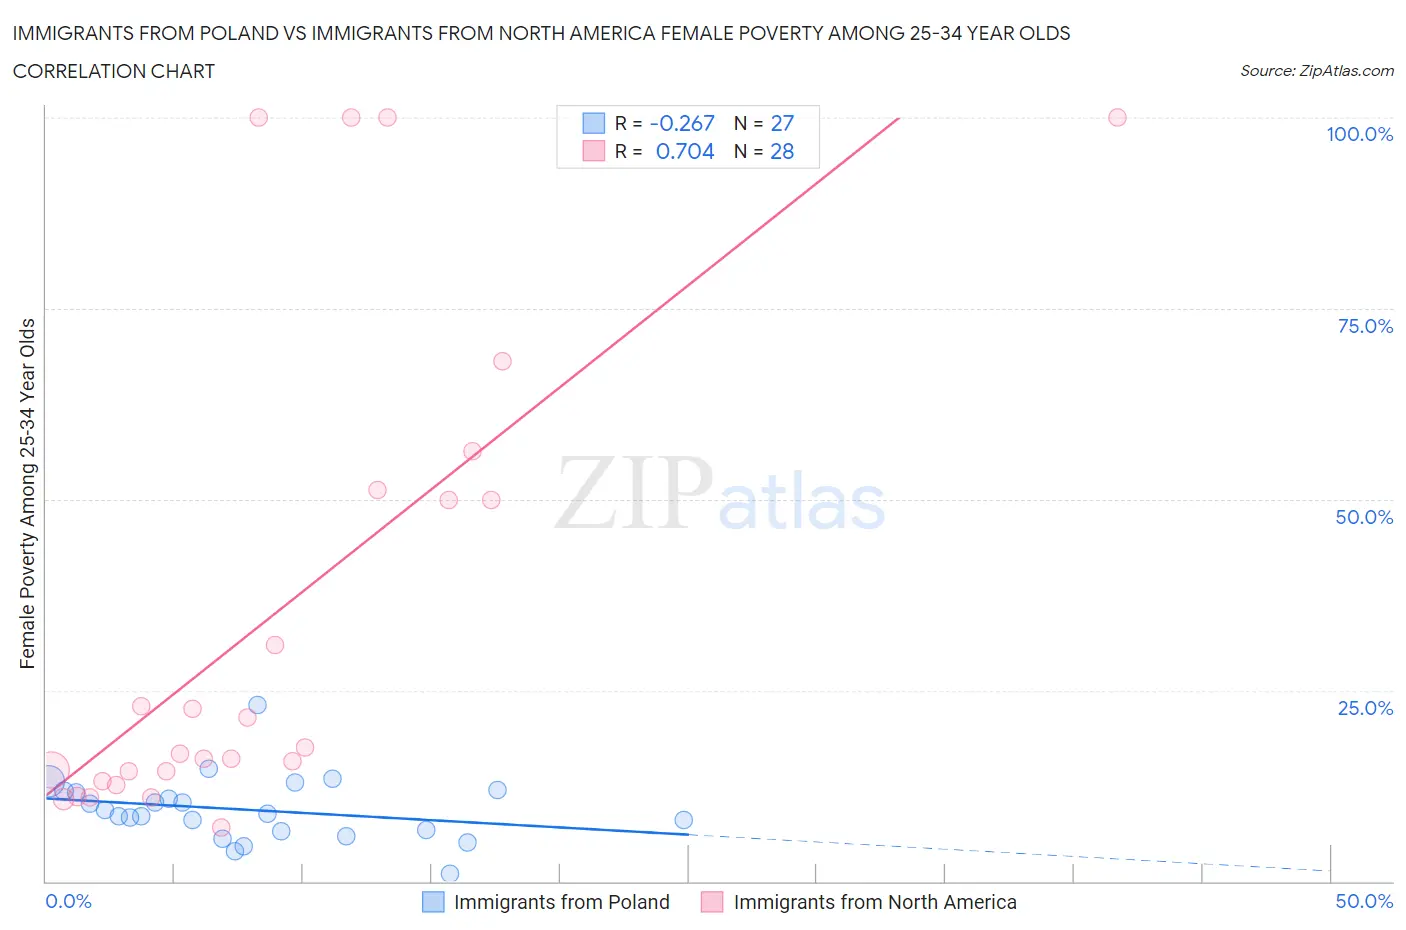
Immigrants from Poland vs Immigrants from North America Female Poverty Among 25-34 Year Olds Correlation Chart
The statistical analysis conducted on geographies consisting of 299,264,805 people shows a weak negative correlation between the proportion of Immigrants from Poland and poverty level among females between the ages 25 and 34 in the United States with a correlation coefficient (R) of -0.267 and weighted average of 11.6%. Similarly, the statistical analysis conducted on geographies consisting of 451,227,492 people shows a strong positive correlation between the proportion of Immigrants from North America and poverty level among females between the ages 25 and 34 in the United States with a correlation coefficient (R) of 0.704 and weighted average of 12.9%, a difference of 11.1%.
Female Poverty Among 25-34 Year Olds Correlation Summary
| Measurement | Immigrants from Poland | Immigrants from North America |
| Minimum | 0.98% | 7.1% |
| Maximum | 23.1% | 100.0% |
| Range | 22.1% | 92.9% |
| Mean | 9.4% | 34.8% |
| Median | 8.8% | 17.1% |
| Interquartile 25% (IQ1) | 6.5% | 13.7% |
| Interquartile 75% (IQ3) | 11.8% | 50.6% |
| Interquartile Range (IQR) | 5.4% | 36.9% |
| Standard Deviation (Sample) | 4.3% | 31.5% |
| Standard Deviation (Population) | 4.2% | 30.9% |
Similar Demographics by Female Poverty Among 25-34 Year Olds
Demographics Similar to Immigrants from Poland by Female Poverty Among 25-34 Year Olds
In terms of female poverty among 25-34 year olds, the demographic groups most similar to Immigrants from Poland are Zimbabwean (11.7%, a difference of 0.22%), Immigrants from Asia (11.6%, a difference of 0.35%), Cambodian (11.7%, a difference of 0.49%), Immigrants from Japan (11.6%, a difference of 0.65%), and Cypriot (11.5%, a difference of 0.94%).
| Demographics | Rating | Rank | Female Poverty Among 25-34 Year Olds |
| Tongans | 99.9 /100 | #26 | Exceptional 11.5% |
| Immigrants | Greece | 99.9 /100 | #27 | Exceptional 11.5% |
| Immigrants | Pakistan | 99.9 /100 | #28 | Exceptional 11.5% |
| Bulgarians | 99.9 /100 | #29 | Exceptional 11.5% |
| Cypriots | 99.9 /100 | #30 | Exceptional 11.5% |
| Immigrants | Japan | 99.9 /100 | #31 | Exceptional 11.6% |
| Immigrants | Asia | 99.9 /100 | #32 | Exceptional 11.6% |
| Immigrants | Poland | 99.9 /100 | #33 | Exceptional 11.6% |
| Zimbabweans | 99.9 /100 | #34 | Exceptional 11.7% |
| Cambodians | 99.9 /100 | #35 | Exceptional 11.7% |
| Immigrants | Sri Lanka | 99.8 /100 | #36 | Exceptional 11.8% |
| Taiwanese | 99.8 /100 | #37 | Exceptional 11.8% |
| Immigrants | North Macedonia | 99.8 /100 | #38 | Exceptional 11.8% |
| Latvians | 99.8 /100 | #39 | Exceptional 11.8% |
| Immigrants | Bulgaria | 99.8 /100 | #40 | Exceptional 11.8% |
Demographics Similar to Immigrants from North America by Female Poverty Among 25-34 Year Olds
In terms of female poverty among 25-34 year olds, the demographic groups most similar to Immigrants from North America are Immigrants from Uzbekistan (12.9%, a difference of 0.030%), Syrian (12.9%, a difference of 0.12%), Czech (12.9%, a difference of 0.13%), Pakistani (13.0%, a difference of 0.30%), and Immigrants from Hungary (13.0%, a difference of 0.32%).
| Demographics | Rating | Rank | Female Poverty Among 25-34 Year Olds |
| Immigrants | Western Asia | 92.7 /100 | #122 | Exceptional 12.8% |
| Slovenes | 92.7 /100 | #123 | Exceptional 12.8% |
| Immigrants | Netherlands | 92.0 /100 | #124 | Exceptional 12.8% |
| Immigrants | Canada | 91.5 /100 | #125 | Exceptional 12.9% |
| Immigrants | Fiji | 91.2 /100 | #126 | Exceptional 12.9% |
| Czechs | 90.3 /100 | #127 | Exceptional 12.9% |
| Syrians | 90.2 /100 | #128 | Exceptional 12.9% |
| Immigrants | North America | 89.7 /100 | #129 | Excellent 12.9% |
| Immigrants | Uzbekistan | 89.6 /100 | #130 | Excellent 12.9% |
| Pakistanis | 88.4 /100 | #131 | Excellent 13.0% |
| Immigrants | Hungary | 88.3 /100 | #132 | Excellent 13.0% |
| Serbians | 87.6 /100 | #133 | Excellent 13.0% |
| Afghans | 85.8 /100 | #134 | Excellent 13.0% |
| South Africans | 85.7 /100 | #135 | Excellent 13.0% |
| Immigrants | England | 85.5 /100 | #136 | Excellent 13.0% |