Immigrants from Central America vs Nicaraguan Child Poverty Under the Age of 5
COMPARE
Immigrants from Central America
Nicaraguan
Child Poverty Under the Age of 5
Child Poverty Under the Age of 5 Comparison
Immigrants from Central America
Nicaraguans
22.0%
CHILD POVERTY UNDER THE AGE OF 5
0.0/ 100
METRIC RATING
301st/ 347
METRIC RANK
19.1%
CHILD POVERTY UNDER THE AGE OF 5
1.6/ 100
METRIC RATING
224th/ 347
METRIC RANK
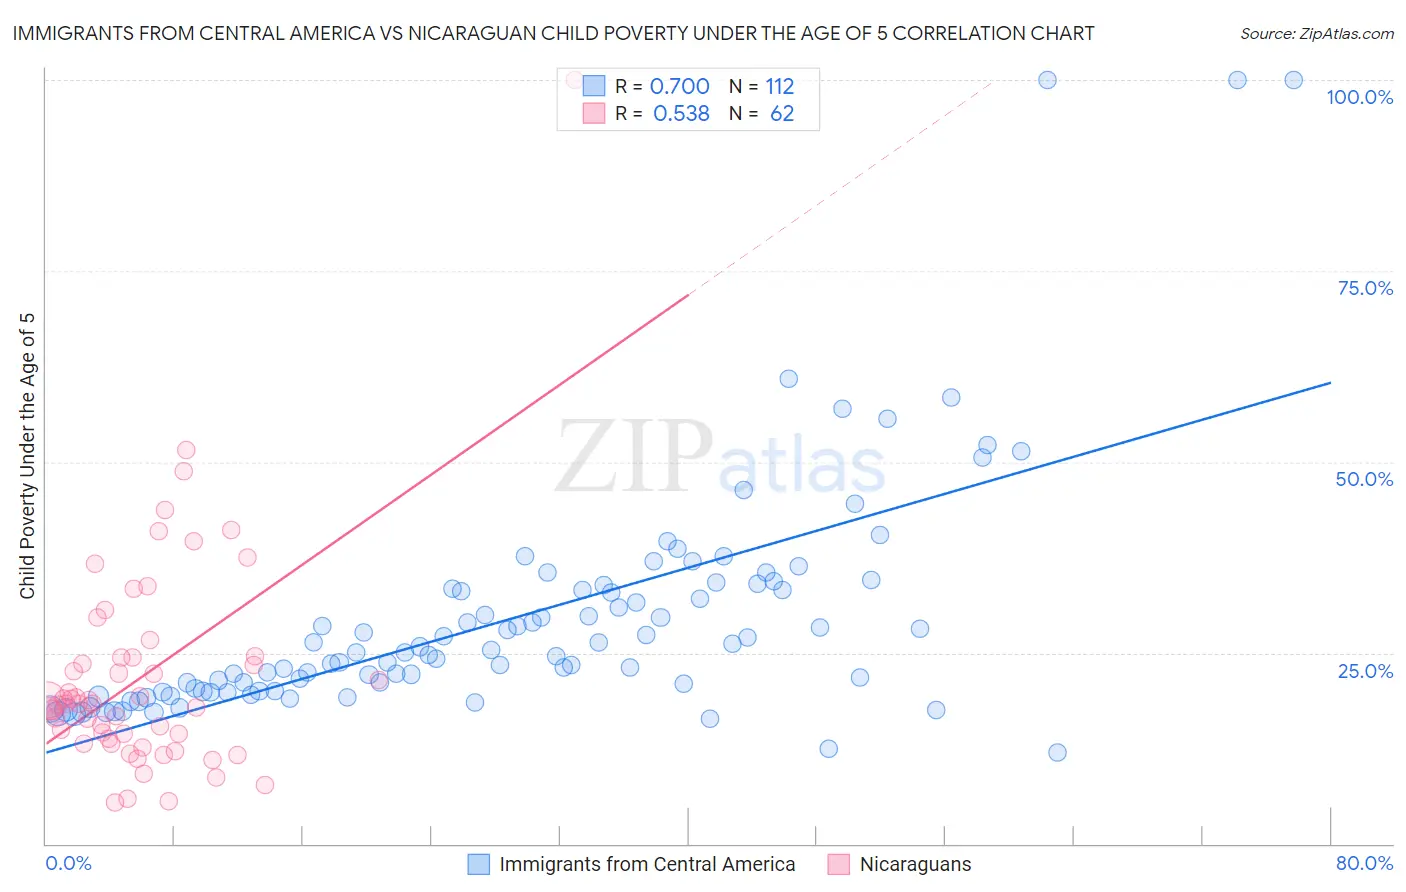
Immigrants from Central America vs Nicaraguan Child Poverty Under the Age of 5 Correlation Chart
The statistical analysis conducted on geographies consisting of 506,999,696 people shows a strong positive correlation between the proportion of Immigrants from Central America and poverty level among children under the age of 5 in the United States with a correlation coefficient (R) of 0.700 and weighted average of 22.0%. Similarly, the statistical analysis conducted on geographies consisting of 279,523,506 people shows a substantial positive correlation between the proportion of Nicaraguans and poverty level among children under the age of 5 in the United States with a correlation coefficient (R) of 0.538 and weighted average of 19.1%, a difference of 15.1%.
Child Poverty Under the Age of 5 Correlation Summary
| Measurement | Immigrants from Central America | Nicaraguan |
| Minimum | 11.9% | 5.4% |
| Maximum | 100.0% | 100.0% |
| Range | 88.1% | 94.6% |
| Mean | 29.4% | 22.0% |
| Median | 25.1% | 18.4% |
| Interquartile 25% (IQ1) | 20.0% | 13.8% |
| Interquartile 75% (IQ3) | 33.4% | 24.4% |
| Interquartile Range (IQR) | 13.4% | 10.7% |
| Standard Deviation (Sample) | 15.4% | 14.6% |
| Standard Deviation (Population) | 15.4% | 14.5% |
Similar Demographics by Child Poverty Under the Age of 5
Demographics Similar to Immigrants from Central America by Child Poverty Under the Age of 5
In terms of child poverty under the age of 5, the demographic groups most similar to Immigrants from Central America are Iroquois (22.0%, a difference of 0.17%), Inupiat (22.0%, a difference of 0.25%), Immigrants from Guatemala (22.0%, a difference of 0.36%), Alaskan Athabascan (21.8%, a difference of 0.66%), and Blackfeet (21.8%, a difference of 0.67%).
| Demographics | Rating | Rank | Child Poverty Under the Age of 5 |
| Guatemalans | 0.0 /100 | #294 | Tragic 21.6% |
| Cherokee | 0.0 /100 | #295 | Tragic 21.7% |
| Yaqui | 0.0 /100 | #296 | Tragic 21.7% |
| Hispanics or Latinos | 0.0 /100 | #297 | Tragic 21.7% |
| Blackfeet | 0.0 /100 | #298 | Tragic 21.8% |
| Chickasaw | 0.0 /100 | #299 | Tragic 21.8% |
| Alaskan Athabascans | 0.0 /100 | #300 | Tragic 21.8% |
| Immigrants | Central America | 0.0 /100 | #301 | Tragic 22.0% |
| Iroquois | 0.0 /100 | #302 | Tragic 22.0% |
| Inupiat | 0.0 /100 | #303 | Tragic 22.0% |
| Immigrants | Guatemala | 0.0 /100 | #304 | Tragic 22.0% |
| Immigrants | Mexico | 0.0 /100 | #305 | Tragic 22.2% |
| Indonesians | 0.0 /100 | #306 | Tragic 22.3% |
| Immigrants | Bahamas | 0.0 /100 | #307 | Tragic 22.7% |
| Immigrants | Dominica | 0.0 /100 | #308 | Tragic 22.7% |
Demographics Similar to Nicaraguans by Child Poverty Under the Age of 5
In terms of child poverty under the age of 5, the demographic groups most similar to Nicaraguans are Nigerian (19.1%, a difference of 0.030%), Immigrants from Eritrea (19.1%, a difference of 0.050%), Cuban (19.1%, a difference of 0.11%), Alsatian (19.1%, a difference of 0.13%), and Cape Verdean (19.1%, a difference of 0.23%).
| Demographics | Rating | Rank | Child Poverty Under the Age of 5 |
| Immigrants | Africa | 4.6 /100 | #217 | Tragic 18.6% |
| Delaware | 3.4 /100 | #218 | Tragic 18.7% |
| German Russians | 3.0 /100 | #219 | Tragic 18.8% |
| Immigrants | Azores | 2.6 /100 | #220 | Tragic 18.9% |
| Immigrants | Nigeria | 2.1 /100 | #221 | Tragic 19.0% |
| Alsatians | 1.7 /100 | #222 | Tragic 19.1% |
| Cubans | 1.7 /100 | #223 | Tragic 19.1% |
| Nicaraguans | 1.6 /100 | #224 | Tragic 19.1% |
| Nigerians | 1.6 /100 | #225 | Tragic 19.1% |
| Immigrants | Eritrea | 1.5 /100 | #226 | Tragic 19.1% |
| Cape Verdeans | 1.4 /100 | #227 | Tragic 19.1% |
| Immigrants | Sudan | 1.3 /100 | #228 | Tragic 19.2% |
| Ghanaians | 1.2 /100 | #229 | Tragic 19.2% |
| Ecuadorians | 1.2 /100 | #230 | Tragic 19.2% |
| Bermudans | 1.2 /100 | #231 | Tragic 19.2% |