Immigrants from Canada vs Fijian Child Poverty Under the Age of 16
COMPARE
Immigrants from Canada
Fijian
Child Poverty Under the Age of 16
Child Poverty Under the Age of 16 Comparison
Immigrants from Canada
Fijians
14.5%
CHILD POVERTY UNDER THE AGE OF 16
97.2/ 100
METRIC RATING
82nd/ 347
METRIC RANK
18.4%
CHILD POVERTY UNDER THE AGE OF 16
1.1/ 100
METRIC RATING
233rd/ 347
METRIC RANK
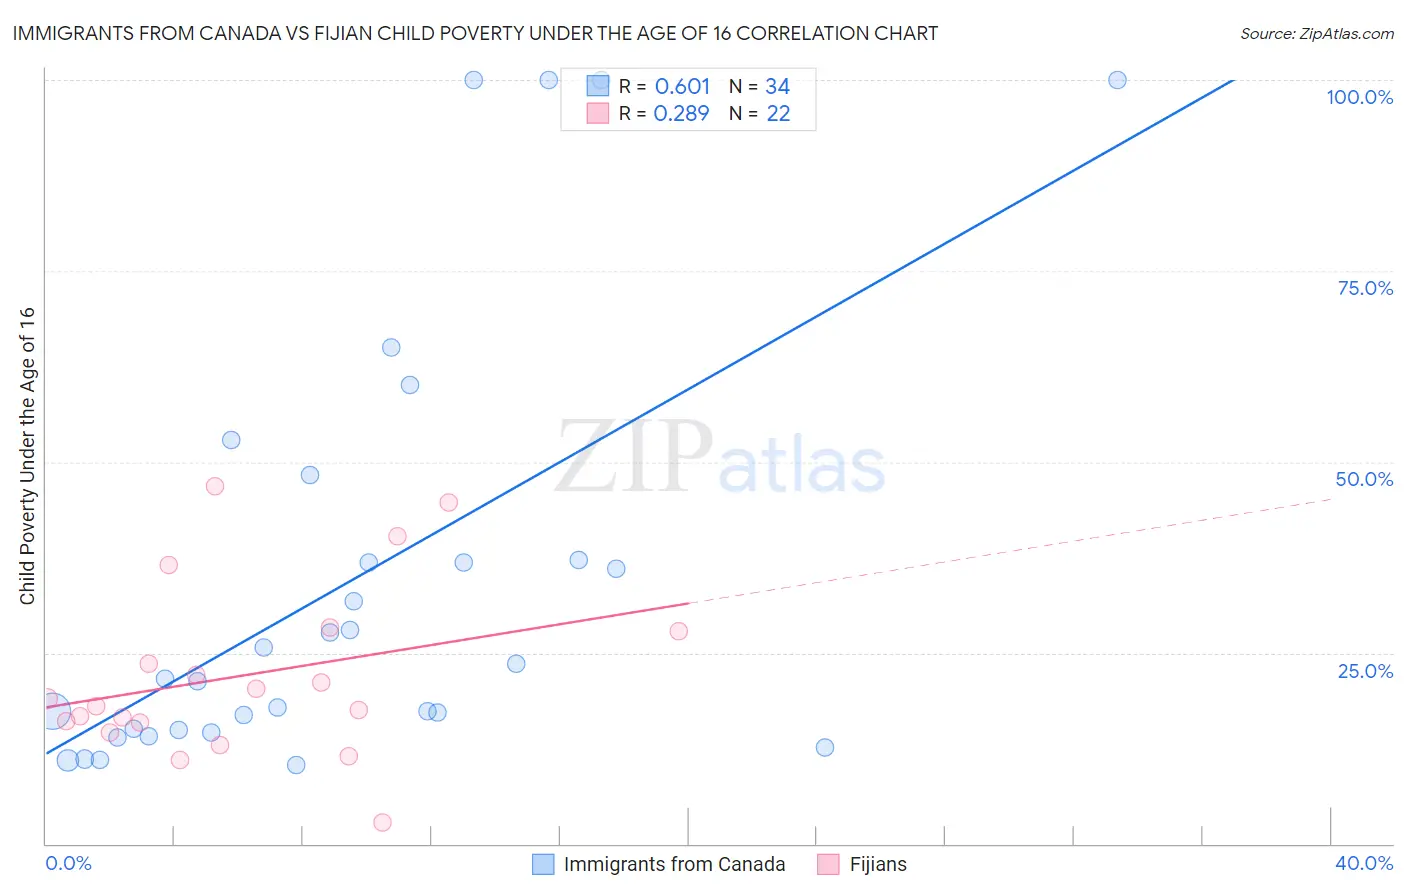
Immigrants from Canada vs Fijian Child Poverty Under the Age of 16 Correlation Chart
The statistical analysis conducted on geographies consisting of 452,889,147 people shows a significant positive correlation between the proportion of Immigrants from Canada and poverty level among children under the age of 16 in the United States with a correlation coefficient (R) of 0.601 and weighted average of 14.5%. Similarly, the statistical analysis conducted on geographies consisting of 55,914,100 people shows a weak positive correlation between the proportion of Fijians and poverty level among children under the age of 16 in the United States with a correlation coefficient (R) of 0.289 and weighted average of 18.4%, a difference of 26.9%.
Child Poverty Under the Age of 16 Correlation Summary
| Measurement | Immigrants from Canada | Fijian |
| Minimum | 10.3% | 2.8% |
| Maximum | 100.0% | 46.8% |
| Range | 89.7% | 43.9% |
| Mean | 34.3% | 22.0% |
| Median | 22.6% | 18.5% |
| Interquartile 25% (IQ1) | 14.9% | 15.9% |
| Interquartile 75% (IQ3) | 37.1% | 27.9% |
| Interquartile Range (IQR) | 22.2% | 12.0% |
| Standard Deviation (Sample) | 28.1% | 11.3% |
| Standard Deviation (Population) | 27.7% | 11.0% |
Similar Demographics by Child Poverty Under the Age of 16
Demographics Similar to Immigrants from Canada by Child Poverty Under the Age of 16
In terms of child poverty under the age of 16, the demographic groups most similar to Immigrants from Canada are Finnish (14.5%, a difference of 0.030%), Egyptian (14.5%, a difference of 0.030%), Immigrants from Latvia (14.5%, a difference of 0.050%), Immigrants from North Macedonia (14.5%, a difference of 0.060%), and Soviet Union (14.5%, a difference of 0.070%).
| Demographics | Rating | Rank | Child Poverty Under the Age of 16 |
| Ukrainians | 97.5 /100 | #75 | Exceptional 14.4% |
| Immigrants | Eastern Europe | 97.5 /100 | #76 | Exceptional 14.4% |
| Australians | 97.5 /100 | #77 | Exceptional 14.4% |
| Immigrants | Russia | 97.3 /100 | #78 | Exceptional 14.5% |
| Swiss | 97.3 /100 | #79 | Exceptional 14.5% |
| Immigrants | North Macedonia | 97.2 /100 | #80 | Exceptional 14.5% |
| Finns | 97.2 /100 | #81 | Exceptional 14.5% |
| Immigrants | Canada | 97.2 /100 | #82 | Exceptional 14.5% |
| Egyptians | 97.2 /100 | #83 | Exceptional 14.5% |
| Immigrants | Latvia | 97.1 /100 | #84 | Exceptional 14.5% |
| Soviet Union | 97.1 /100 | #85 | Exceptional 14.5% |
| Immigrants | Argentina | 97.1 /100 | #86 | Exceptional 14.5% |
| Taiwanese | 97.1 /100 | #87 | Exceptional 14.5% |
| Northern Europeans | 97.0 /100 | #88 | Exceptional 14.5% |
| Germans | 96.9 /100 | #89 | Exceptional 14.5% |
Demographics Similar to Fijians by Child Poverty Under the Age of 16
In terms of child poverty under the age of 16, the demographic groups most similar to Fijians are American (18.3%, a difference of 0.22%), Immigrants from Nigeria (18.4%, a difference of 0.25%), Nigerian (18.4%, a difference of 0.31%), Cree (18.5%, a difference of 0.60%), and Sudanese (18.5%, a difference of 0.63%).
| Demographics | Rating | Rank | Child Poverty Under the Age of 16 |
| Bermudans | 2.6 /100 | #226 | Tragic 18.0% |
| Immigrants | Africa | 2.5 /100 | #227 | Tragic 18.0% |
| Immigrants | Micronesia | 2.3 /100 | #228 | Tragic 18.0% |
| Marshallese | 1.8 /100 | #229 | Tragic 18.1% |
| Nepalese | 1.7 /100 | #230 | Tragic 18.2% |
| Nicaraguans | 1.7 /100 | #231 | Tragic 18.2% |
| Americans | 1.2 /100 | #232 | Tragic 18.3% |
| Fijians | 1.1 /100 | #233 | Tragic 18.4% |
| Immigrants | Nigeria | 1.0 /100 | #234 | Tragic 18.4% |
| Nigerians | 1.0 /100 | #235 | Tragic 18.4% |
| Cree | 0.9 /100 | #236 | Tragic 18.5% |
| Sudanese | 0.9 /100 | #237 | Tragic 18.5% |
| Immigrants | Eritrea | 0.8 /100 | #238 | Tragic 18.5% |
| Immigrants | Sudan | 0.8 /100 | #239 | Tragic 18.5% |
| Ghanaians | 0.8 /100 | #240 | Tragic 18.6% |