Immigrants from Bolivia vs Immigrants from Sierra Leone Child Poverty Among Boys Under 16
COMPARE
Immigrants from Bolivia
Immigrants from Sierra Leone
Child Poverty Among Boys Under 16
Child Poverty Among Boys Under 16 Comparison
Immigrants from Bolivia
Immigrants from Sierra Leone
13.5%
CHILD POVERTY AMONG BOYS UNDER 16
99.8/ 100
METRIC RATING
26th/ 347
METRIC RANK
17.3%
CHILD POVERTY AMONG BOYS UNDER 16
13.4/ 100
METRIC RATING
202nd/ 347
METRIC RANK
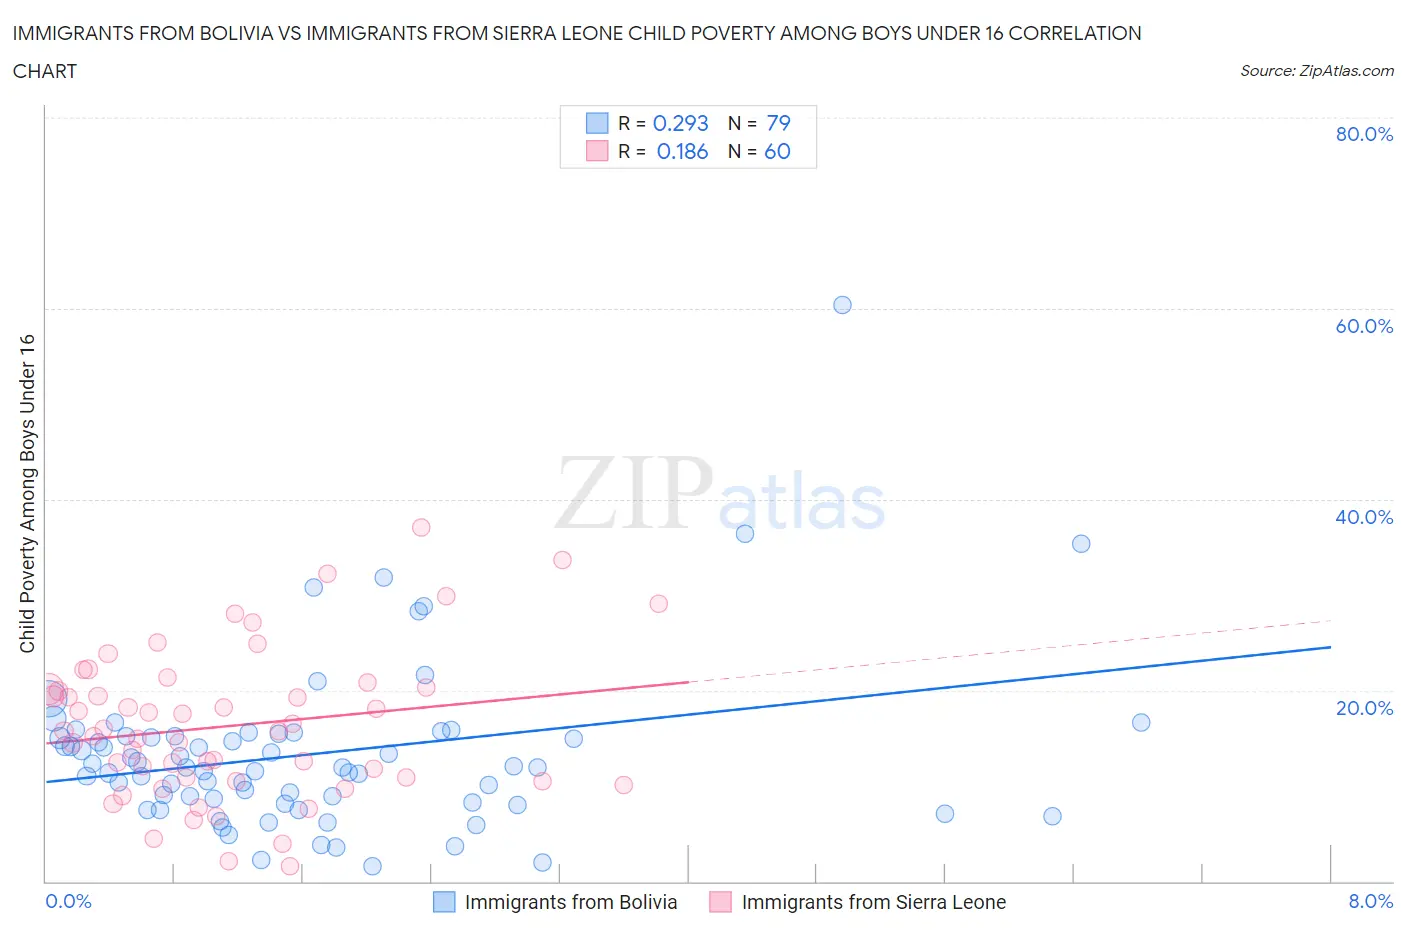
Immigrants from Bolivia vs Immigrants from Sierra Leone Child Poverty Among Boys Under 16 Correlation Chart
The statistical analysis conducted on geographies consisting of 157,748,153 people shows a weak positive correlation between the proportion of Immigrants from Bolivia and poverty level among boys under the age of 16 in the United States with a correlation coefficient (R) of 0.293 and weighted average of 13.5%. Similarly, the statistical analysis conducted on geographies consisting of 101,288,430 people shows a poor positive correlation between the proportion of Immigrants from Sierra Leone and poverty level among boys under the age of 16 in the United States with a correlation coefficient (R) of 0.186 and weighted average of 17.3%, a difference of 28.0%.
Child Poverty Among Boys Under 16 Correlation Summary
| Measurement | Immigrants from Bolivia | Immigrants from Sierra Leone |
| Minimum | 1.6% | 1.6% |
| Maximum | 60.4% | 37.1% |
| Range | 58.8% | 35.5% |
| Mean | 13.3% | 16.3% |
| Median | 11.9% | 15.7% |
| Interquartile 25% (IQ1) | 8.2% | 10.7% |
| Interquartile 75% (IQ3) | 15.2% | 20.2% |
| Interquartile Range (IQR) | 7.0% | 9.5% |
| Standard Deviation (Sample) | 8.8% | 7.8% |
| Standard Deviation (Population) | 8.8% | 7.7% |
Similar Demographics by Child Poverty Among Boys Under 16
Demographics Similar to Immigrants from Bolivia by Child Poverty Among Boys Under 16
In terms of child poverty among boys under 16, the demographic groups most similar to Immigrants from Bolivia are Okinawan (13.5%, a difference of 0.080%), Asian (13.5%, a difference of 0.080%), Eastern European (13.5%, a difference of 0.15%), Immigrants from Lithuania (13.5%, a difference of 0.20%), and Cypriot (13.6%, a difference of 0.34%).
| Demographics | Rating | Rank | Child Poverty Among Boys Under 16 |
| Bolivians | 99.9 /100 | #19 | Exceptional 13.3% |
| Indians (Asian) | 99.9 /100 | #20 | Exceptional 13.3% |
| Immigrants | Eastern Asia | 99.9 /100 | #21 | Exceptional 13.3% |
| Tongans | 99.9 /100 | #22 | Exceptional 13.4% |
| Latvians | 99.9 /100 | #23 | Exceptional 13.4% |
| Immigrants | Lithuania | 99.8 /100 | #24 | Exceptional 13.5% |
| Okinawans | 99.8 /100 | #25 | Exceptional 13.5% |
| Immigrants | Bolivia | 99.8 /100 | #26 | Exceptional 13.5% |
| Asians | 99.8 /100 | #27 | Exceptional 13.5% |
| Eastern Europeans | 99.8 /100 | #28 | Exceptional 13.5% |
| Cypriots | 99.8 /100 | #29 | Exceptional 13.6% |
| Swedes | 99.8 /100 | #30 | Exceptional 13.6% |
| Turks | 99.8 /100 | #31 | Exceptional 13.6% |
| Immigrants | China | 99.8 /100 | #32 | Exceptional 13.6% |
| Danes | 99.8 /100 | #33 | Exceptional 13.6% |
Demographics Similar to Immigrants from Sierra Leone by Child Poverty Among Boys Under 16
In terms of child poverty among boys under 16, the demographic groups most similar to Immigrants from Sierra Leone are Immigrants from Uzbekistan (17.3%, a difference of 0.020%), Immigrants from Afghanistan (17.3%, a difference of 0.060%), Ugandan (17.3%, a difference of 0.22%), Immigrants from Portugal (17.4%, a difference of 0.55%), and German Russian (17.4%, a difference of 0.61%).
| Demographics | Rating | Rank | Child Poverty Among Boys Under 16 |
| Spanish | 20.8 /100 | #195 | Fair 17.0% |
| Spaniards | 20.5 /100 | #196 | Fair 17.1% |
| Immigrants | Kenya | 20.1 /100 | #197 | Fair 17.1% |
| Immigrants | Cameroon | 19.0 /100 | #198 | Poor 17.1% |
| Delaware | 18.8 /100 | #199 | Poor 17.1% |
| Immigrants | Uruguay | 16.9 /100 | #200 | Poor 17.2% |
| Immigrants | Afghanistan | 13.7 /100 | #201 | Poor 17.3% |
| Immigrants | Sierra Leone | 13.4 /100 | #202 | Poor 17.3% |
| Immigrants | Uzbekistan | 13.3 /100 | #203 | Poor 17.3% |
| Ugandans | 12.5 /100 | #204 | Poor 17.3% |
| Immigrants | Portugal | 11.2 /100 | #205 | Poor 17.4% |
| German Russians | 10.9 /100 | #206 | Poor 17.4% |
| Immigrants | Thailand | 8.2 /100 | #207 | Tragic 17.5% |
| Malaysians | 7.6 /100 | #208 | Tragic 17.6% |
| Alaskan Athabascans | 7.3 /100 | #209 | Tragic 17.6% |