Immigrants from Argentina vs Immigrants from Sierra Leone Child Poverty Among Boys Under 16
COMPARE
Immigrants from Argentina
Immigrants from Sierra Leone
Child Poverty Among Boys Under 16
Child Poverty Among Boys Under 16 Comparison
Immigrants from Argentina
Immigrants from Sierra Leone
14.8%
CHILD POVERTY AMONG BOYS UNDER 16
97.1/ 100
METRIC RATING
89th/ 347
METRIC RANK
17.3%
CHILD POVERTY AMONG BOYS UNDER 16
13.4/ 100
METRIC RATING
202nd/ 347
METRIC RANK
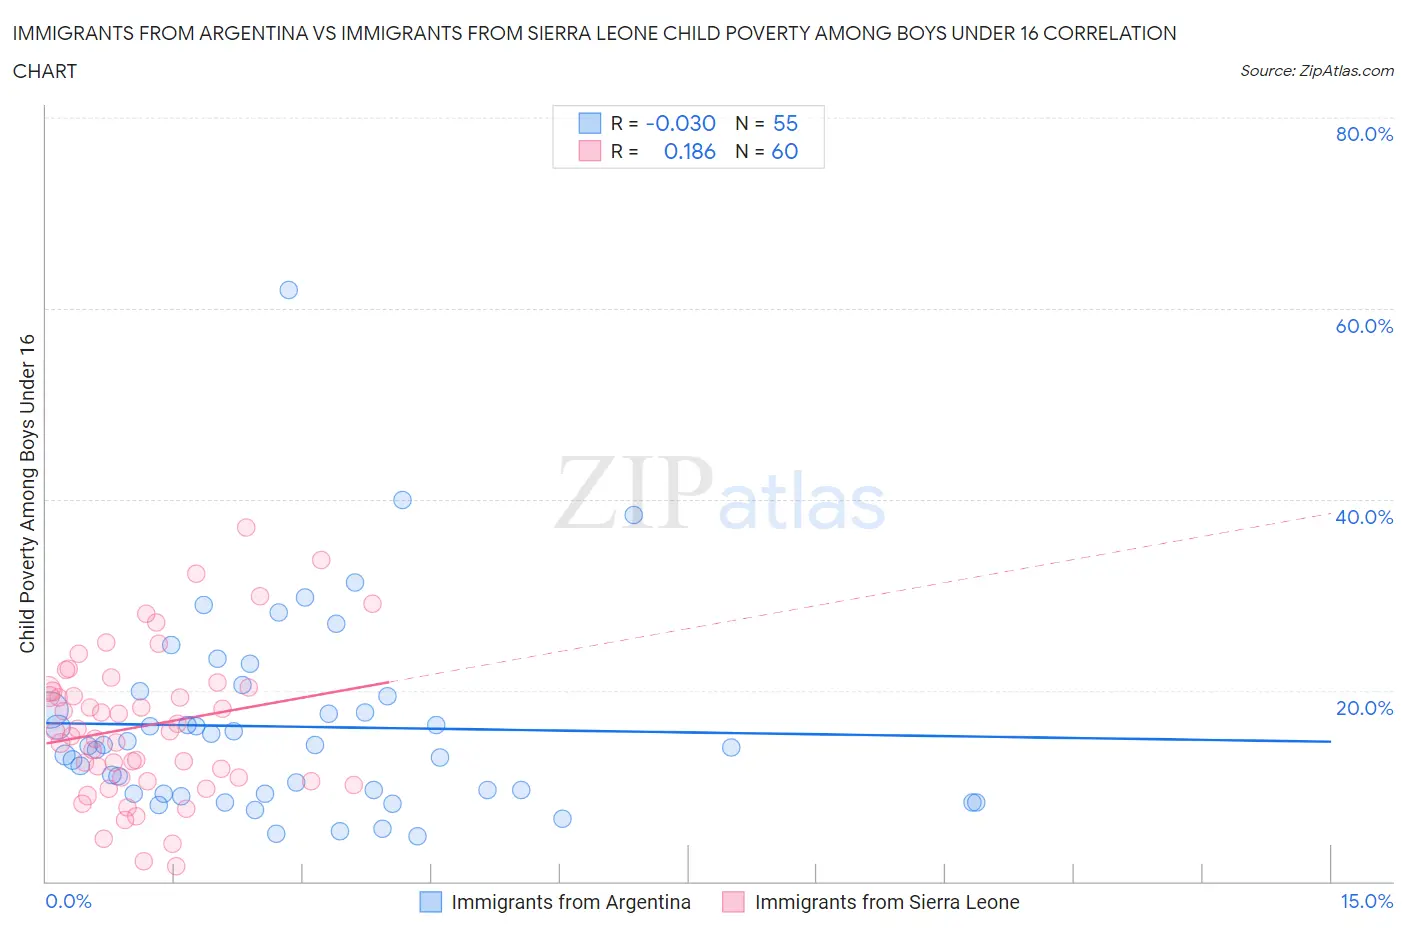
Immigrants from Argentina vs Immigrants from Sierra Leone Child Poverty Among Boys Under 16 Correlation Chart
The statistical analysis conducted on geographies consisting of 261,385,346 people shows no correlation between the proportion of Immigrants from Argentina and poverty level among boys under the age of 16 in the United States with a correlation coefficient (R) of -0.030 and weighted average of 14.8%. Similarly, the statistical analysis conducted on geographies consisting of 101,288,430 people shows a poor positive correlation between the proportion of Immigrants from Sierra Leone and poverty level among boys under the age of 16 in the United States with a correlation coefficient (R) of 0.186 and weighted average of 17.3%, a difference of 16.6%.
Child Poverty Among Boys Under 16 Correlation Summary
| Measurement | Immigrants from Argentina | Immigrants from Sierra Leone |
| Minimum | 4.7% | 1.6% |
| Maximum | 61.9% | 37.1% |
| Range | 57.2% | 35.5% |
| Mean | 16.2% | 16.3% |
| Median | 14.2% | 15.7% |
| Interquartile 25% (IQ1) | 9.2% | 10.7% |
| Interquartile 75% (IQ3) | 19.4% | 20.2% |
| Interquartile Range (IQR) | 10.2% | 9.5% |
| Standard Deviation (Sample) | 10.2% | 7.8% |
| Standard Deviation (Population) | 10.2% | 7.7% |
Similar Demographics by Child Poverty Among Boys Under 16
Demographics Similar to Immigrants from Argentina by Child Poverty Among Boys Under 16
In terms of child poverty among boys under 16, the demographic groups most similar to Immigrants from Argentina are Austrian (14.8%, a difference of 0.010%), Immigrants from North America (14.8%, a difference of 0.070%), Northern European (14.8%, a difference of 0.090%), German (14.8%, a difference of 0.14%), and Taiwanese (14.8%, a difference of 0.21%).
| Demographics | Rating | Rank | Child Poverty Among Boys Under 16 |
| Ukrainians | 97.6 /100 | #82 | Exceptional 14.7% |
| Immigrants | South Africa | 97.4 /100 | #83 | Exceptional 14.8% |
| Swiss | 97.3 /100 | #84 | Exceptional 14.8% |
| Taiwanese | 97.3 /100 | #85 | Exceptional 14.8% |
| Germans | 97.2 /100 | #86 | Exceptional 14.8% |
| Northern Europeans | 97.2 /100 | #87 | Exceptional 14.8% |
| Immigrants | North America | 97.1 /100 | #88 | Exceptional 14.8% |
| Immigrants | Argentina | 97.1 /100 | #89 | Exceptional 14.8% |
| Austrians | 97.1 /100 | #90 | Exceptional 14.8% |
| Paraguayans | 96.8 /100 | #91 | Exceptional 14.9% |
| Argentineans | 96.7 /100 | #92 | Exceptional 14.9% |
| Sri Lankans | 96.7 /100 | #93 | Exceptional 14.9% |
| Immigrants | Italy | 96.7 /100 | #94 | Exceptional 14.9% |
| Finns | 96.5 /100 | #95 | Exceptional 14.9% |
| Immigrants | North Macedonia | 96.3 /100 | #96 | Exceptional 14.9% |
Demographics Similar to Immigrants from Sierra Leone by Child Poverty Among Boys Under 16
In terms of child poverty among boys under 16, the demographic groups most similar to Immigrants from Sierra Leone are Immigrants from Uzbekistan (17.3%, a difference of 0.020%), Immigrants from Afghanistan (17.3%, a difference of 0.060%), Ugandan (17.3%, a difference of 0.22%), Immigrants from Portugal (17.4%, a difference of 0.55%), and German Russian (17.4%, a difference of 0.61%).
| Demographics | Rating | Rank | Child Poverty Among Boys Under 16 |
| Spanish | 20.8 /100 | #195 | Fair 17.0% |
| Spaniards | 20.5 /100 | #196 | Fair 17.1% |
| Immigrants | Kenya | 20.1 /100 | #197 | Fair 17.1% |
| Immigrants | Cameroon | 19.0 /100 | #198 | Poor 17.1% |
| Delaware | 18.8 /100 | #199 | Poor 17.1% |
| Immigrants | Uruguay | 16.9 /100 | #200 | Poor 17.2% |
| Immigrants | Afghanistan | 13.7 /100 | #201 | Poor 17.3% |
| Immigrants | Sierra Leone | 13.4 /100 | #202 | Poor 17.3% |
| Immigrants | Uzbekistan | 13.3 /100 | #203 | Poor 17.3% |
| Ugandans | 12.5 /100 | #204 | Poor 17.3% |
| Immigrants | Portugal | 11.2 /100 | #205 | Poor 17.4% |
| German Russians | 10.9 /100 | #206 | Poor 17.4% |
| Immigrants | Thailand | 8.2 /100 | #207 | Tragic 17.5% |
| Malaysians | 7.6 /100 | #208 | Tragic 17.6% |
| Alaskan Athabascans | 7.3 /100 | #209 | Tragic 17.6% |