Immigrants from Bolivia vs Immigrants from Serbia Child Poverty Under the Age of 16
COMPARE
Immigrants from Bolivia
Immigrants from Serbia
Child Poverty Under the Age of 16
Child Poverty Under the Age of 16 Comparison
Immigrants from Bolivia
Immigrants from Serbia
13.6%
CHILD POVERTY UNDER THE AGE OF 16
99.6/ 100
METRIC RATING
37th/ 347
METRIC RANK
14.1%
CHILD POVERTY UNDER THE AGE OF 16
98.7/ 100
METRIC RATING
56th/ 347
METRIC RANK
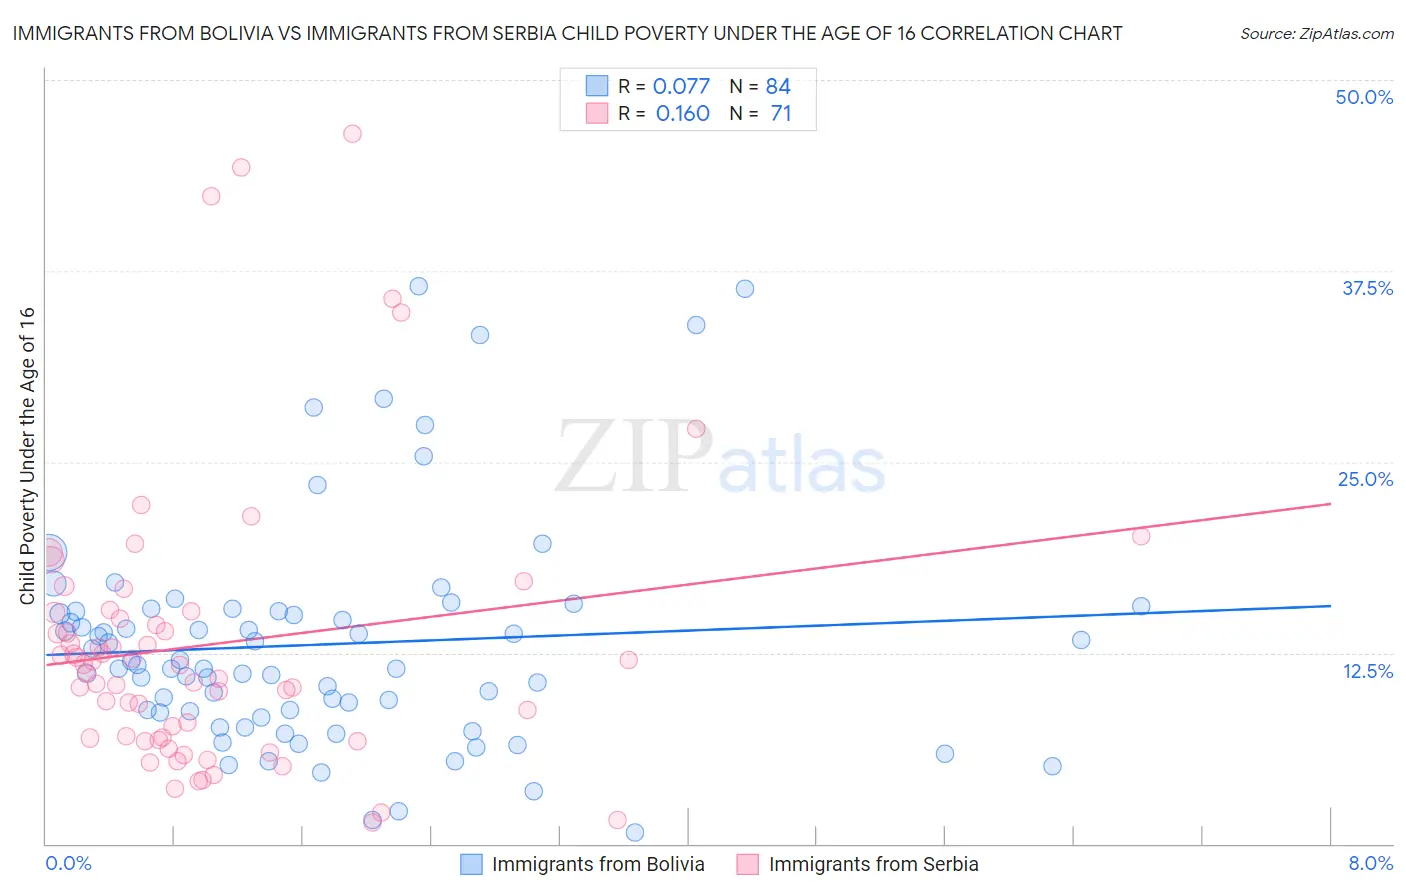
Immigrants from Bolivia vs Immigrants from Serbia Child Poverty Under the Age of 16 Correlation Chart
The statistical analysis conducted on geographies consisting of 158,228,551 people shows a slight positive correlation between the proportion of Immigrants from Bolivia and poverty level among children under the age of 16 in the United States with a correlation coefficient (R) of 0.077 and weighted average of 13.6%. Similarly, the statistical analysis conducted on geographies consisting of 131,341,340 people shows a poor positive correlation between the proportion of Immigrants from Serbia and poverty level among children under the age of 16 in the United States with a correlation coefficient (R) of 0.160 and weighted average of 14.1%, a difference of 4.0%.
Child Poverty Under the Age of 16 Correlation Summary
| Measurement | Immigrants from Bolivia | Immigrants from Serbia |
| Minimum | 0.74% | 1.4% |
| Maximum | 36.5% | 46.5% |
| Range | 35.8% | 45.1% |
| Mean | 13.1% | 13.1% |
| Median | 11.6% | 11.7% |
| Interquartile 25% (IQ1) | 8.6% | 6.9% |
| Interquartile 75% (IQ3) | 15.2% | 15.2% |
| Interquartile Range (IQR) | 6.6% | 8.2% |
| Standard Deviation (Sample) | 7.4% | 9.3% |
| Standard Deviation (Population) | 7.3% | 9.2% |
Demographics Similar to Immigrants from Bolivia and Immigrants from Serbia by Child Poverty Under the Age of 16
In terms of child poverty under the age of 16, the demographic groups most similar to Immigrants from Bolivia are Immigrants from Northern Europe (13.6%, a difference of 0.010%), Luxembourger (13.6%, a difference of 0.51%), Immigrants from Australia (13.6%, a difference of 0.54%), Immigrants from Scotland (13.7%, a difference of 1.2%), and Croatian (13.8%, a difference of 1.4%). Similarly, the demographic groups most similar to Immigrants from Serbia are Immigrants from Indonesia (14.1%, a difference of 0.17%), Tsimshian (14.1%, a difference of 0.24%), Immigrants from Israel (14.1%, a difference of 0.27%), Polish (14.0%, a difference of 0.58%), and Immigrants from Greece (13.9%, a difference of 1.3%).
| Demographics | Rating | Rank | Child Poverty Under the Age of 16 |
| Immigrants | Northern Europe | 99.6 /100 | #36 | Exceptional 13.6% |
| Immigrants | Bolivia | 99.6 /100 | #37 | Exceptional 13.6% |
| Luxembourgers | 99.5 /100 | #38 | Exceptional 13.6% |
| Immigrants | Australia | 99.5 /100 | #39 | Exceptional 13.6% |
| Immigrants | Scotland | 99.4 /100 | #40 | Exceptional 13.7% |
| Croatians | 99.4 /100 | #41 | Exceptional 13.8% |
| Immigrants | Sri Lanka | 99.3 /100 | #42 | Exceptional 13.8% |
| Immigrants | Moldova | 99.3 /100 | #43 | Exceptional 13.8% |
| Greeks | 99.3 /100 | #44 | Exceptional 13.8% |
| Czechs | 99.3 /100 | #45 | Exceptional 13.8% |
| Immigrants | Asia | 99.2 /100 | #46 | Exceptional 13.8% |
| Estonians | 99.2 /100 | #47 | Exceptional 13.9% |
| Koreans | 99.2 /100 | #48 | Exceptional 13.9% |
| Italians | 99.2 /100 | #49 | Exceptional 13.9% |
| Immigrants | Czechoslovakia | 99.1 /100 | #50 | Exceptional 13.9% |
| Immigrants | Greece | 99.1 /100 | #51 | Exceptional 13.9% |
| Poles | 98.9 /100 | #52 | Exceptional 14.0% |
| Immigrants | Israel | 98.8 /100 | #53 | Exceptional 14.1% |
| Tsimshian | 98.8 /100 | #54 | Exceptional 14.1% |
| Immigrants | Indonesia | 98.7 /100 | #55 | Exceptional 14.1% |
| Immigrants | Serbia | 98.7 /100 | #56 | Exceptional 14.1% |