Immigrants from Belgium vs Central American Female Poverty Among 18-24 Year Olds
COMPARE
Immigrants from Belgium
Central American
Female Poverty Among 18-24 Year Olds
Female Poverty Among 18-24 Year Olds Comparison
Immigrants from Belgium
Central Americans
19.8%
FEMALE POVERTY AMONG 18-24 YEAR OLDS
76.4/ 100
METRIC RATING
156th/ 347
METRIC RANK
19.9%
FEMALE POVERTY AMONG 18-24 YEAR OLDS
70.0/ 100
METRIC RATING
164th/ 347
METRIC RANK
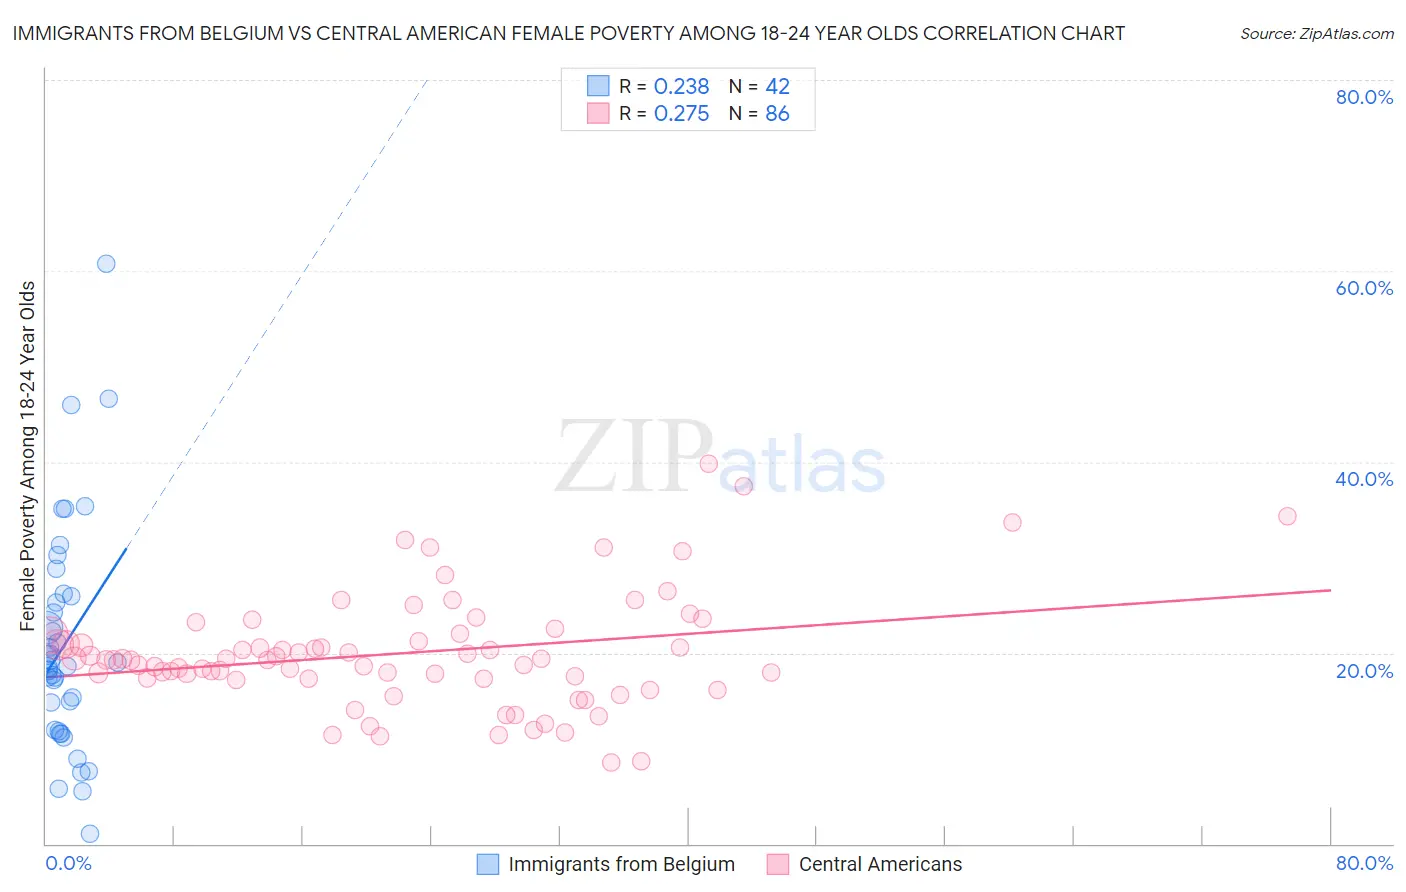
Immigrants from Belgium vs Central American Female Poverty Among 18-24 Year Olds Correlation Chart
The statistical analysis conducted on geographies consisting of 144,999,845 people shows a weak positive correlation between the proportion of Immigrants from Belgium and poverty level among females between the ages 18 and 24 in the United States with a correlation coefficient (R) of 0.238 and weighted average of 19.8%. Similarly, the statistical analysis conducted on geographies consisting of 487,103,061 people shows a weak positive correlation between the proportion of Central Americans and poverty level among females between the ages 18 and 24 in the United States with a correlation coefficient (R) of 0.275 and weighted average of 19.9%, a difference of 0.41%.
Female Poverty Among 18-24 Year Olds Correlation Summary
| Measurement | Immigrants from Belgium | Central American |
| Minimum | 0.99% | 8.5% |
| Maximum | 60.8% | 39.8% |
| Range | 59.8% | 31.3% |
| Mean | 20.9% | 20.0% |
| Median | 18.8% | 19.3% |
| Interquartile 25% (IQ1) | 11.9% | 17.3% |
| Interquartile 75% (IQ3) | 26.0% | 21.9% |
| Interquartile Range (IQR) | 14.1% | 4.6% |
| Standard Deviation (Sample) | 11.9% | 5.9% |
| Standard Deviation (Population) | 11.8% | 5.9% |
Demographics Similar to Immigrants from Belgium and Central Americans by Female Poverty Among 18-24 Year Olds
In terms of female poverty among 18-24 year olds, the demographic groups most similar to Immigrants from Belgium are Hungarian (19.8%, a difference of 0.010%), Immigrants from Zimbabwe (19.8%, a difference of 0.020%), Danish (19.8%, a difference of 0.060%), Immigrants from Lebanon (19.8%, a difference of 0.080%), and Immigrants from Japan (19.8%, a difference of 0.12%). Similarly, the demographic groups most similar to Central Americans are Eastern European (19.9%, a difference of 0.040%), Belgian (19.9%, a difference of 0.050%), Malaysian (19.9%, a difference of 0.16%), French Canadian (19.9%, a difference of 0.19%), and Immigrants from Belize (19.8%, a difference of 0.25%).
| Demographics | Rating | Rank | Female Poverty Among 18-24 Year Olds |
| Syrians | 80.2 /100 | #150 | Excellent 19.8% |
| Immigrants | Eastern Asia | 79.7 /100 | #151 | Good 19.8% |
| Yugoslavians | 79.0 /100 | #152 | Good 19.8% |
| Immigrants | Japan | 78.1 /100 | #153 | Good 19.8% |
| Immigrants | Zimbabwe | 76.7 /100 | #154 | Good 19.8% |
| Hungarians | 76.6 /100 | #155 | Good 19.8% |
| Immigrants | Belgium | 76.4 /100 | #156 | Good 19.8% |
| Danes | 75.5 /100 | #157 | Good 19.8% |
| Immigrants | Lebanon | 75.3 /100 | #158 | Good 19.8% |
| Trinidadians and Tobagonians | 74.4 /100 | #159 | Good 19.8% |
| Pakistanis | 74.1 /100 | #160 | Good 19.8% |
| Immigrants | Belize | 74.1 /100 | #161 | Good 19.8% |
| French Canadians | 73.0 /100 | #162 | Good 19.9% |
| Malaysians | 72.7 /100 | #163 | Good 19.9% |
| Central Americans | 70.0 /100 | #164 | Good 19.9% |
| Eastern Europeans | 69.3 /100 | #165 | Good 19.9% |
| Belgians | 69.1 /100 | #166 | Good 19.9% |
| Czechoslovakians | 61.8 /100 | #167 | Good 20.0% |
| Fijians | 59.1 /100 | #168 | Average 20.0% |
| Hmong | 55.4 /100 | #169 | Average 20.0% |
| Iranians | 54.7 /100 | #170 | Average 20.1% |