Immigrants from Belgium vs Immigrants from Guyana Female Poverty Among 18-24 Year Olds
COMPARE
Immigrants from Belgium
Immigrants from Guyana
Female Poverty Among 18-24 Year Olds
Female Poverty Among 18-24 Year Olds Comparison
Immigrants from Belgium
Immigrants from Guyana
19.8%
FEMALE POVERTY AMONG 18-24 YEAR OLDS
76.4/ 100
METRIC RATING
156th/ 347
METRIC RANK
19.3%
FEMALE POVERTY AMONG 18-24 YEAR OLDS
95.6/ 100
METRIC RATING
118th/ 347
METRIC RANK
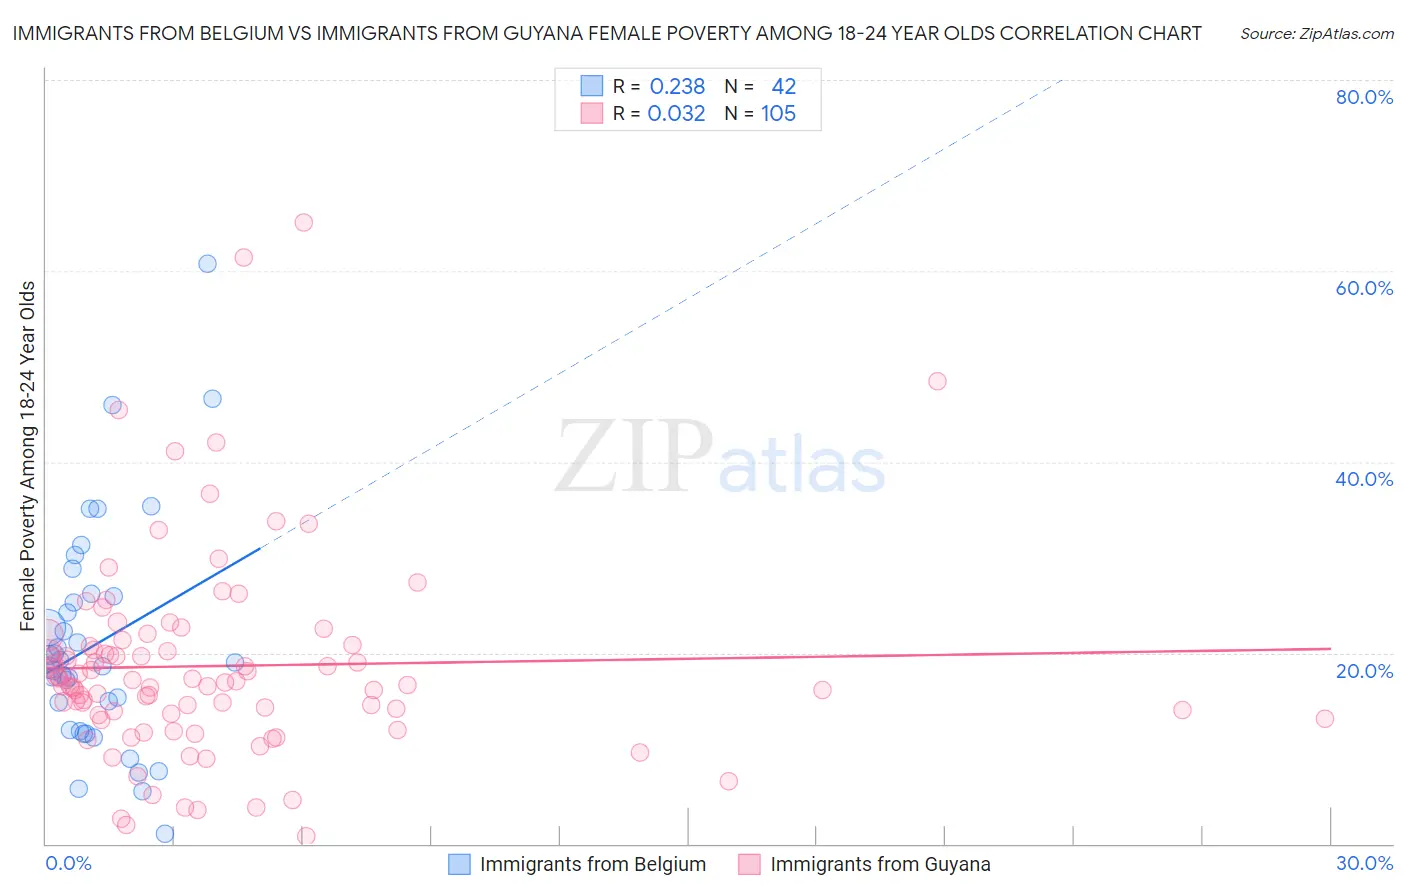
Immigrants from Belgium vs Immigrants from Guyana Female Poverty Among 18-24 Year Olds Correlation Chart
The statistical analysis conducted on geographies consisting of 144,999,845 people shows a weak positive correlation between the proportion of Immigrants from Belgium and poverty level among females between the ages 18 and 24 in the United States with a correlation coefficient (R) of 0.238 and weighted average of 19.8%. Similarly, the statistical analysis conducted on geographies consisting of 181,126,975 people shows no correlation between the proportion of Immigrants from Guyana and poverty level among females between the ages 18 and 24 in the United States with a correlation coefficient (R) of 0.032 and weighted average of 19.3%, a difference of 2.4%.
Female Poverty Among 18-24 Year Olds Correlation Summary
| Measurement | Immigrants from Belgium | Immigrants from Guyana |
| Minimum | 0.99% | 0.84% |
| Maximum | 60.8% | 65.1% |
| Range | 59.8% | 64.3% |
| Mean | 20.9% | 18.6% |
| Median | 18.8% | 16.9% |
| Interquartile 25% (IQ1) | 11.9% | 13.5% |
| Interquartile 75% (IQ3) | 26.0% | 20.7% |
| Interquartile Range (IQR) | 14.1% | 7.2% |
| Standard Deviation (Sample) | 11.9% | 10.6% |
| Standard Deviation (Population) | 11.8% | 10.6% |
Similar Demographics by Female Poverty Among 18-24 Year Olds
Demographics Similar to Immigrants from Belgium by Female Poverty Among 18-24 Year Olds
In terms of female poverty among 18-24 year olds, the demographic groups most similar to Immigrants from Belgium are Hungarian (19.8%, a difference of 0.010%), Immigrants from Zimbabwe (19.8%, a difference of 0.020%), Danish (19.8%, a difference of 0.060%), Immigrants from Lebanon (19.8%, a difference of 0.080%), and Immigrants from Japan (19.8%, a difference of 0.12%).
| Demographics | Rating | Rank | Female Poverty Among 18-24 Year Olds |
| Immigrants | Oceania | 81.2 /100 | #149 | Excellent 19.7% |
| Syrians | 80.2 /100 | #150 | Excellent 19.8% |
| Immigrants | Eastern Asia | 79.7 /100 | #151 | Good 19.8% |
| Yugoslavians | 79.0 /100 | #152 | Good 19.8% |
| Immigrants | Japan | 78.1 /100 | #153 | Good 19.8% |
| Immigrants | Zimbabwe | 76.7 /100 | #154 | Good 19.8% |
| Hungarians | 76.6 /100 | #155 | Good 19.8% |
| Immigrants | Belgium | 76.4 /100 | #156 | Good 19.8% |
| Danes | 75.5 /100 | #157 | Good 19.8% |
| Immigrants | Lebanon | 75.3 /100 | #158 | Good 19.8% |
| Trinidadians and Tobagonians | 74.4 /100 | #159 | Good 19.8% |
| Pakistanis | 74.1 /100 | #160 | Good 19.8% |
| Immigrants | Belize | 74.1 /100 | #161 | Good 19.8% |
| French Canadians | 73.0 /100 | #162 | Good 19.9% |
| Malaysians | 72.7 /100 | #163 | Good 19.9% |
Demographics Similar to Immigrants from Guyana by Female Poverty Among 18-24 Year Olds
In terms of female poverty among 18-24 year olds, the demographic groups most similar to Immigrants from Guyana are Cypriot (19.3%, a difference of 0.020%), Immigrants from Iran (19.3%, a difference of 0.060%), Immigrants from Northern Europe (19.4%, a difference of 0.060%), Immigrants (19.3%, a difference of 0.090%), and Guyanese (19.4%, a difference of 0.090%).
| Demographics | Rating | Rank | Female Poverty Among 18-24 Year Olds |
| Immigrants | Serbia | 97.1 /100 | #111 | Exceptional 19.2% |
| Immigrants | El Salvador | 96.5 /100 | #112 | Exceptional 19.3% |
| Immigrants | Cameroon | 96.3 /100 | #113 | Exceptional 19.3% |
| Slovenes | 96.2 /100 | #114 | Exceptional 19.3% |
| Immigrants | Hungary | 96.2 /100 | #115 | Exceptional 19.3% |
| Immigrants | Immigrants | 95.9 /100 | #116 | Exceptional 19.3% |
| Immigrants | Iran | 95.8 /100 | #117 | Exceptional 19.3% |
| Immigrants | Guyana | 95.6 /100 | #118 | Exceptional 19.3% |
| Cypriots | 95.5 /100 | #119 | Exceptional 19.3% |
| Immigrants | Northern Europe | 95.4 /100 | #120 | Exceptional 19.4% |
| Guyanese | 95.3 /100 | #121 | Exceptional 19.4% |
| Cambodians | 94.6 /100 | #122 | Exceptional 19.4% |
| Paraguayans | 94.6 /100 | #123 | Exceptional 19.4% |
| Immigrants | Chile | 94.3 /100 | #124 | Exceptional 19.4% |
| Immigrants | Panama | 94.0 /100 | #125 | Exceptional 19.4% |