Immigrants from Belgium vs Central American 4th Grade
COMPARE
Immigrants from Belgium
Central American
4th Grade
4th Grade Comparison
Immigrants from Belgium
Central Americans
97.9%
4TH GRADE
99.0/ 100
METRIC RATING
83rd/ 347
METRIC RANK
95.5%
4TH GRADE
0.0/ 100
METRIC RATING
337th/ 347
METRIC RANK
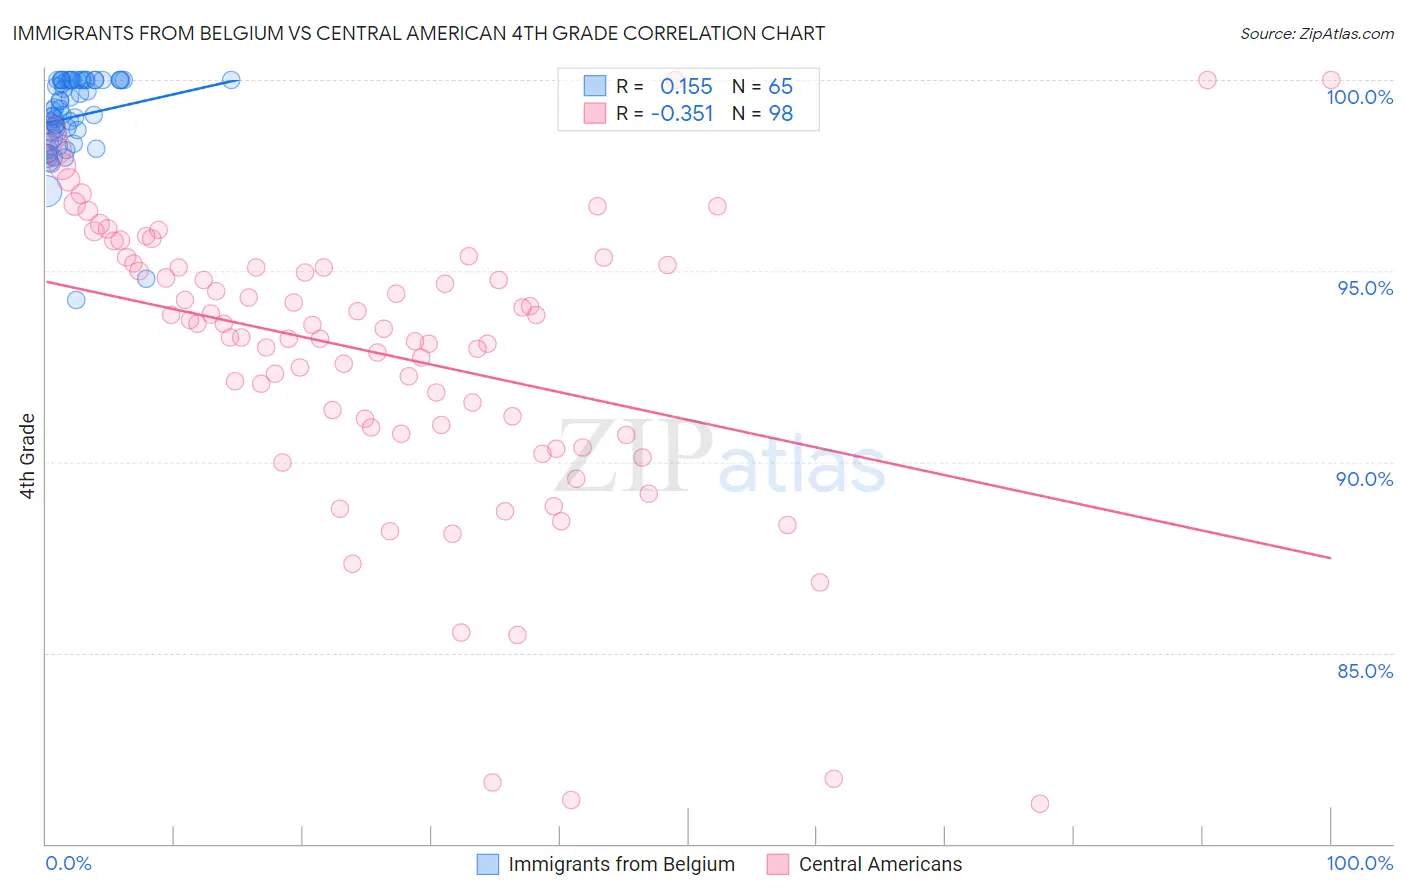
Immigrants from Belgium vs Central American 4th Grade Correlation Chart
The statistical analysis conducted on geographies consisting of 146,727,969 people shows a poor positive correlation between the proportion of Immigrants from Belgium and percentage of population with at least 4th grade education in the United States with a correlation coefficient (R) of 0.155 and weighted average of 97.9%. Similarly, the statistical analysis conducted on geographies consisting of 504,618,163 people shows a mild negative correlation between the proportion of Central Americans and percentage of population with at least 4th grade education in the United States with a correlation coefficient (R) of -0.351 and weighted average of 95.5%, a difference of 2.6%.
4th Grade Correlation Summary
| Measurement | Immigrants from Belgium | Central American |
| Minimum | 94.2% | 81.0% |
| Maximum | 100.0% | 100.0% |
| Range | 5.8% | 19.0% |
| Mean | 99.0% | 92.8% |
| Median | 99.1% | 93.5% |
| Interquartile 25% (IQ1) | 98.4% | 90.9% |
| Interquartile 75% (IQ3) | 100.0% | 95.2% |
| Interquartile Range (IQR) | 1.6% | 4.3% |
| Standard Deviation (Sample) | 1.1% | 3.8% |
| Standard Deviation (Population) | 1.1% | 3.8% |
Similar Demographics by 4th Grade
Demographics Similar to Immigrants from Belgium by 4th Grade
In terms of 4th grade, the demographic groups most similar to Immigrants from Belgium are Icelander (98.0%, a difference of 0.010%), Cypriot (97.9%, a difference of 0.010%), Potawatomi (97.9%, a difference of 0.010%), Immigrants from Australia (97.9%, a difference of 0.010%), and Ukrainian (98.0%, a difference of 0.020%).
| Demographics | Rating | Rank | 4th Grade |
| Cherokee | 99.3 /100 | #76 | Exceptional 98.0% |
| Immigrants | Lithuania | 99.3 /100 | #77 | Exceptional 98.0% |
| Immigrants | England | 99.3 /100 | #78 | Exceptional 98.0% |
| Ukrainians | 99.2 /100 | #79 | Exceptional 98.0% |
| Osage | 99.2 /100 | #80 | Exceptional 98.0% |
| Immigrants | India | 99.1 /100 | #81 | Exceptional 98.0% |
| Icelanders | 99.1 /100 | #82 | Exceptional 98.0% |
| Immigrants | Belgium | 99.0 /100 | #83 | Exceptional 97.9% |
| Cypriots | 98.9 /100 | #84 | Exceptional 97.9% |
| Potawatomi | 98.9 /100 | #85 | Exceptional 97.9% |
| Immigrants | Australia | 98.8 /100 | #86 | Exceptional 97.9% |
| Zimbabweans | 98.8 /100 | #87 | Exceptional 97.9% |
| Immigrants | South Africa | 98.8 /100 | #88 | Exceptional 97.9% |
| Delaware | 98.8 /100 | #89 | Exceptional 97.9% |
| Immigrants | Denmark | 98.7 /100 | #90 | Exceptional 97.9% |
Demographics Similar to Central Americans by 4th Grade
In terms of 4th grade, the demographic groups most similar to Central Americans are Nepalese (95.5%, a difference of 0.0%), Mexican (95.6%, a difference of 0.13%), Immigrants from Latin America (95.7%, a difference of 0.19%), Guatemalan (95.3%, a difference of 0.20%), and Immigrants from Dominican Republic (95.7%, a difference of 0.26%).
| Demographics | Rating | Rank | 4th Grade |
| Immigrants | Fiji | 0.0 /100 | #330 | Tragic 95.8% |
| Immigrants | Armenia | 0.0 /100 | #331 | Tragic 95.8% |
| Immigrants | Honduras | 0.0 /100 | #332 | Tragic 95.8% |
| Immigrants | Dominican Republic | 0.0 /100 | #333 | Tragic 95.7% |
| Immigrants | Cabo Verde | 0.0 /100 | #334 | Tragic 95.7% |
| Immigrants | Latin America | 0.0 /100 | #335 | Tragic 95.7% |
| Mexicans | 0.0 /100 | #336 | Tragic 95.6% |
| Central Americans | 0.0 /100 | #337 | Tragic 95.5% |
| Nepalese | 0.0 /100 | #338 | Tragic 95.5% |
| Guatemalans | 0.0 /100 | #339 | Tragic 95.3% |
| Yakama | 0.0 /100 | #340 | Tragic 95.2% |
| Immigrants | Yemen | 0.0 /100 | #341 | Tragic 95.2% |
| Immigrants | Central America | 0.0 /100 | #342 | Tragic 95.1% |
| Immigrants | Guatemala | 0.0 /100 | #343 | Tragic 95.1% |
| Immigrants | Mexico | 0.0 /100 | #344 | Tragic 95.1% |