Immigrants from Belarus vs Immigrants from Ecuador Child Poverty Among Boys Under 16
COMPARE
Immigrants from Belarus
Immigrants from Ecuador
Child Poverty Among Boys Under 16
Child Poverty Among Boys Under 16 Comparison
Immigrants from Belarus
Immigrants from Ecuador
15.0%
CHILD POVERTY AMONG BOYS UNDER 16
95.7/ 100
METRIC RATING
101st/ 347
METRIC RANK
19.8%
CHILD POVERTY AMONG BOYS UNDER 16
0.1/ 100
METRIC RATING
272nd/ 347
METRIC RANK
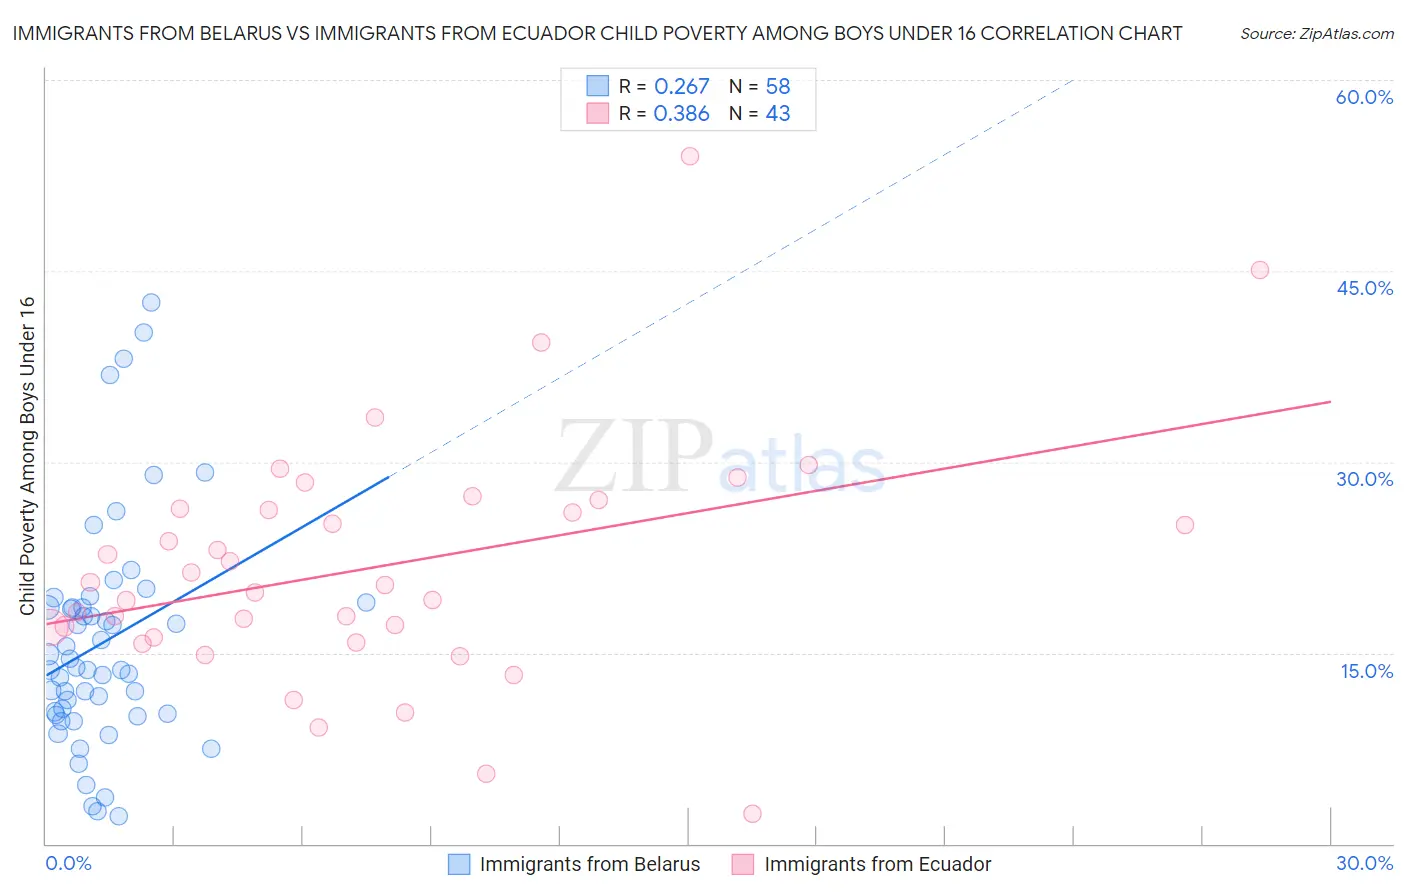
Immigrants from Belarus vs Immigrants from Ecuador Child Poverty Among Boys Under 16 Correlation Chart
The statistical analysis conducted on geographies consisting of 148,931,301 people shows a weak positive correlation between the proportion of Immigrants from Belarus and poverty level among boys under the age of 16 in the United States with a correlation coefficient (R) of 0.267 and weighted average of 15.0%. Similarly, the statistical analysis conducted on geographies consisting of 267,854,704 people shows a mild positive correlation between the proportion of Immigrants from Ecuador and poverty level among boys under the age of 16 in the United States with a correlation coefficient (R) of 0.386 and weighted average of 19.8%, a difference of 32.2%.
Child Poverty Among Boys Under 16 Correlation Summary
| Measurement | Immigrants from Belarus | Immigrants from Ecuador |
| Minimum | 2.2% | 2.4% |
| Maximum | 42.5% | 54.0% |
| Range | 40.4% | 51.6% |
| Mean | 15.8% | 21.7% |
| Median | 13.7% | 20.4% |
| Interquartile 25% (IQ1) | 10.2% | 16.2% |
| Interquartile 75% (IQ3) | 18.6% | 26.3% |
| Interquartile Range (IQR) | 8.4% | 10.1% |
| Standard Deviation (Sample) | 8.8% | 9.6% |
| Standard Deviation (Population) | 8.8% | 9.5% |
Similar Demographics by Child Poverty Among Boys Under 16
Demographics Similar to Immigrants from Belarus by Child Poverty Among Boys Under 16
In terms of child poverty among boys under 16, the demographic groups most similar to Immigrants from Belarus are Chilean (15.0%, a difference of 0.050%), Romanian (15.0%, a difference of 0.070%), Immigrants from Denmark (15.0%, a difference of 0.11%), Immigrants from Switzerland (15.0%, a difference of 0.21%), and Dutch (15.0%, a difference of 0.22%).
| Demographics | Rating | Rank | Child Poverty Among Boys Under 16 |
| Immigrants | Italy | 96.7 /100 | #94 | Exceptional 14.9% |
| Finns | 96.5 /100 | #95 | Exceptional 14.9% |
| Immigrants | North Macedonia | 96.3 /100 | #96 | Exceptional 14.9% |
| Immigrants | Egypt | 96.2 /100 | #97 | Exceptional 14.9% |
| British | 96.2 /100 | #98 | Exceptional 15.0% |
| Immigrants | France | 96.1 /100 | #99 | Exceptional 15.0% |
| Chileans | 95.8 /100 | #100 | Exceptional 15.0% |
| Immigrants | Belarus | 95.7 /100 | #101 | Exceptional 15.0% |
| Romanians | 95.6 /100 | #102 | Exceptional 15.0% |
| Immigrants | Denmark | 95.6 /100 | #103 | Exceptional 15.0% |
| Immigrants | Switzerland | 95.4 /100 | #104 | Exceptional 15.0% |
| Dutch | 95.4 /100 | #105 | Exceptional 15.0% |
| Serbians | 95.2 /100 | #106 | Exceptional 15.1% |
| Jordanians | 95.1 /100 | #107 | Exceptional 15.1% |
| Immigrants | England | 94.8 /100 | #108 | Exceptional 15.1% |
Demographics Similar to Immigrants from Ecuador by Child Poverty Among Boys Under 16
In terms of child poverty among boys under 16, the demographic groups most similar to Immigrants from Ecuador are Belizean (19.9%, a difference of 0.14%), Chickasaw (19.8%, a difference of 0.22%), Immigrants from Bangladesh (19.9%, a difference of 0.39%), Jamaican (20.0%, a difference of 0.52%), and Subsaharan African (20.0%, a difference of 0.69%).
| Demographics | Rating | Rank | Child Poverty Among Boys Under 16 |
| Guyanese | 0.1 /100 | #265 | Tragic 19.6% |
| Immigrants | El Salvador | 0.1 /100 | #266 | Tragic 19.6% |
| Vietnamese | 0.1 /100 | #267 | Tragic 19.6% |
| Spanish American Indians | 0.1 /100 | #268 | Tragic 19.6% |
| Immigrants | Cabo Verde | 0.1 /100 | #269 | Tragic 19.7% |
| Cherokee | 0.1 /100 | #270 | Tragic 19.7% |
| Chickasaw | 0.1 /100 | #271 | Tragic 19.8% |
| Immigrants | Ecuador | 0.1 /100 | #272 | Tragic 19.8% |
| Belizeans | 0.1 /100 | #273 | Tragic 19.9% |
| Immigrants | Bangladesh | 0.0 /100 | #274 | Tragic 19.9% |
| Jamaicans | 0.0 /100 | #275 | Tragic 20.0% |
| Sub-Saharan Africans | 0.0 /100 | #276 | Tragic 20.0% |
| Immigrants | Barbados | 0.0 /100 | #277 | Tragic 20.0% |
| Immigrants | West Indies | 0.0 /100 | #278 | Tragic 20.0% |
| Bangladeshis | 0.0 /100 | #279 | Tragic 20.0% |