Canadian vs French Canadian Seniors Poverty Over the Age of 75
COMPARE
Canadian
French Canadian
Seniors Poverty Over the Age of 75
Seniors Poverty Over the Age of 75 Comparison
Canadians
French Canadians
11.3%
SENIORS POVERTY OVER THE AGE OF 75
97.7/ 100
METRIC RATING
61st/ 347
METRIC RANK
11.4%
SENIORS POVERTY OVER THE AGE OF 75
95.7/ 100
METRIC RATING
76th/ 347
METRIC RANK
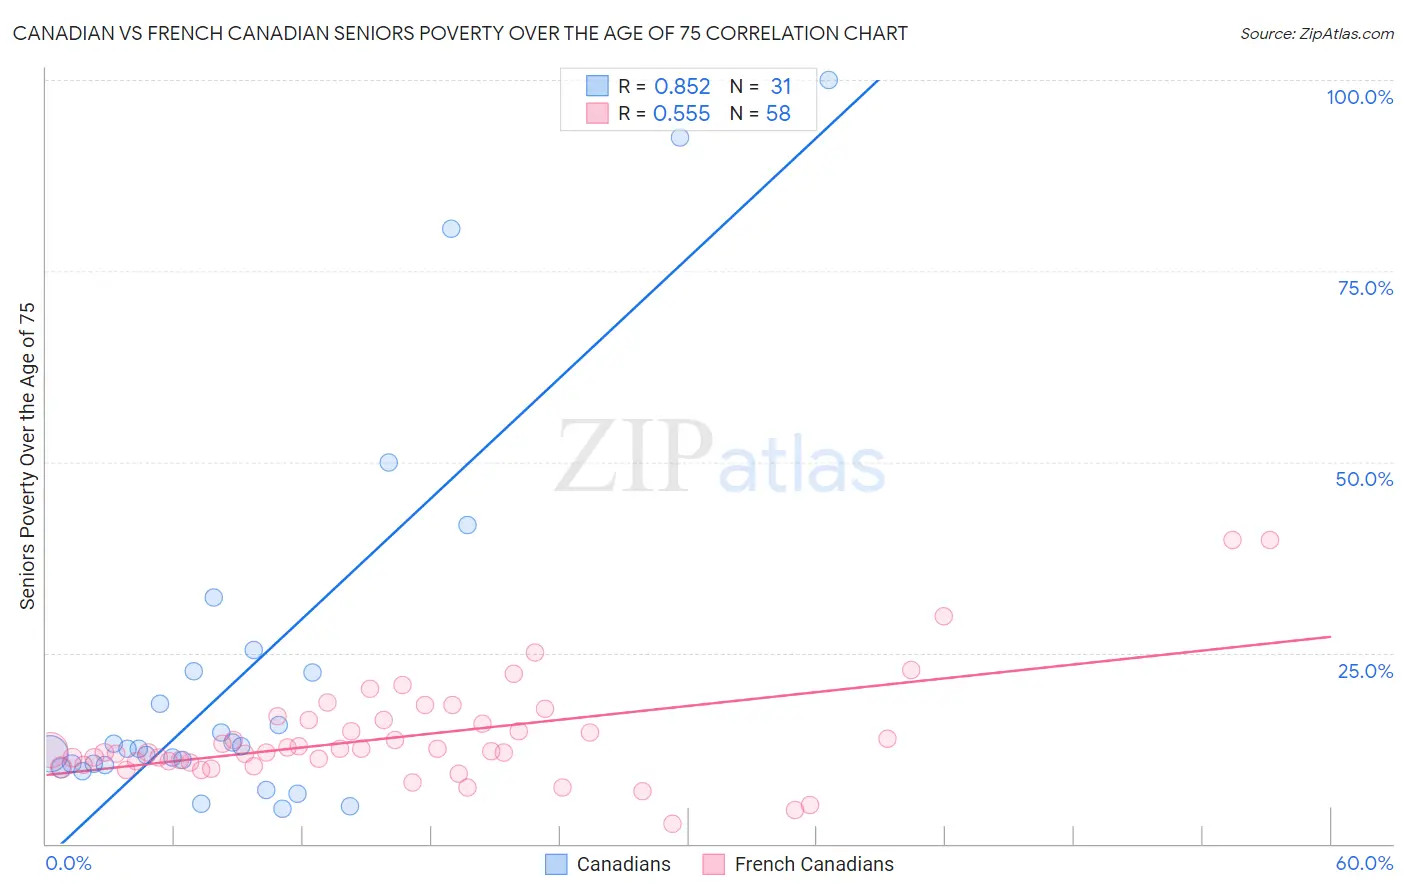
Canadian vs French Canadian Seniors Poverty Over the Age of 75 Correlation Chart
The statistical analysis conducted on geographies consisting of 430,823,365 people shows a very strong positive correlation between the proportion of Canadians and poverty level among seniors over the age of 75 in the United States with a correlation coefficient (R) of 0.852 and weighted average of 11.3%. Similarly, the statistical analysis conducted on geographies consisting of 492,347,297 people shows a substantial positive correlation between the proportion of French Canadians and poverty level among seniors over the age of 75 in the United States with a correlation coefficient (R) of 0.555 and weighted average of 11.4%, a difference of 1.4%.
Seniors Poverty Over the Age of 75 Correlation Summary
| Measurement | Canadian | French Canadian |
| Minimum | 4.7% | 2.6% |
| Maximum | 100.0% | 39.7% |
| Range | 95.3% | 37.2% |
| Mean | 22.7% | 14.0% |
| Median | 12.5% | 12.1% |
| Interquartile 25% (IQ1) | 10.3% | 10.6% |
| Interquartile 75% (IQ3) | 22.6% | 16.1% |
| Interquartile Range (IQR) | 12.3% | 5.6% |
| Standard Deviation (Sample) | 25.0% | 6.9% |
| Standard Deviation (Population) | 24.6% | 6.9% |
Demographics Similar to Canadians and French Canadians by Seniors Poverty Over the Age of 75
In terms of seniors poverty over the age of 75, the demographic groups most similar to Canadians are Eastern European (11.3%, a difference of 0.030%), Immigrants from North America (11.3%, a difference of 0.10%), Immigrants from Afghanistan (11.3%, a difference of 0.14%), Immigrants from Netherlands (11.2%, a difference of 0.15%), and Yugoslavian (11.2%, a difference of 0.23%). Similarly, the demographic groups most similar to French Canadians are Palestinian (11.4%, a difference of 0.070%), White/Caucasian (11.4%, a difference of 0.080%), Macedonian (11.4%, a difference of 0.090%), Delaware (11.4%, a difference of 0.16%), and Immigrants from Micronesia (11.4%, a difference of 0.17%).
| Demographics | Rating | Rank | Seniors Poverty Over the Age of 75 |
| Yugoslavians | 97.9 /100 | #58 | Exceptional 11.2% |
| Immigrants | Netherlands | 97.8 /100 | #59 | Exceptional 11.2% |
| Eastern Europeans | 97.7 /100 | #60 | Exceptional 11.3% |
| Canadians | 97.7 /100 | #61 | Exceptional 11.3% |
| Immigrants | North America | 97.6 /100 | #62 | Exceptional 11.3% |
| Immigrants | Afghanistan | 97.5 /100 | #63 | Exceptional 11.3% |
| Immigrants | Northern Europe | 97.4 /100 | #64 | Exceptional 11.3% |
| Immigrants | Taiwan | 96.7 /100 | #65 | Exceptional 11.4% |
| Estonians | 96.7 /100 | #66 | Exceptional 11.4% |
| Bolivians | 96.5 /100 | #67 | Exceptional 11.4% |
| Immigrants | Austria | 96.5 /100 | #68 | Exceptional 11.4% |
| Ottawa | 96.5 /100 | #69 | Exceptional 11.4% |
| Immigrants | South Central Asia | 96.4 /100 | #70 | Exceptional 11.4% |
| Osage | 96.3 /100 | #71 | Exceptional 11.4% |
| Sierra Leoneans | 96.1 /100 | #72 | Exceptional 11.4% |
| Immigrants | Micronesia | 96.0 /100 | #73 | Exceptional 11.4% |
| Delaware | 96.0 /100 | #74 | Exceptional 11.4% |
| Palestinians | 95.8 /100 | #75 | Exceptional 11.4% |
| French Canadians | 95.7 /100 | #76 | Exceptional 11.4% |
| Whites/Caucasians | 95.5 /100 | #77 | Exceptional 11.4% |
| Macedonians | 95.5 /100 | #78 | Exceptional 11.4% |