Immigrants from Bahamas vs Immigrants from Western Asia Single Male Poverty
COMPARE
Immigrants from Bahamas
Immigrants from Western Asia
Single Male Poverty
Single Male Poverty Comparison
Immigrants from Bahamas
Immigrants from Western Asia
14.4%
SINGLE MALE POVERTY
0.0/ 100
METRIC RATING
284th/ 347
METRIC RANK
12.5%
SINGLE MALE POVERTY
83.4/ 100
METRIC RATING
133rd/ 347
METRIC RANK
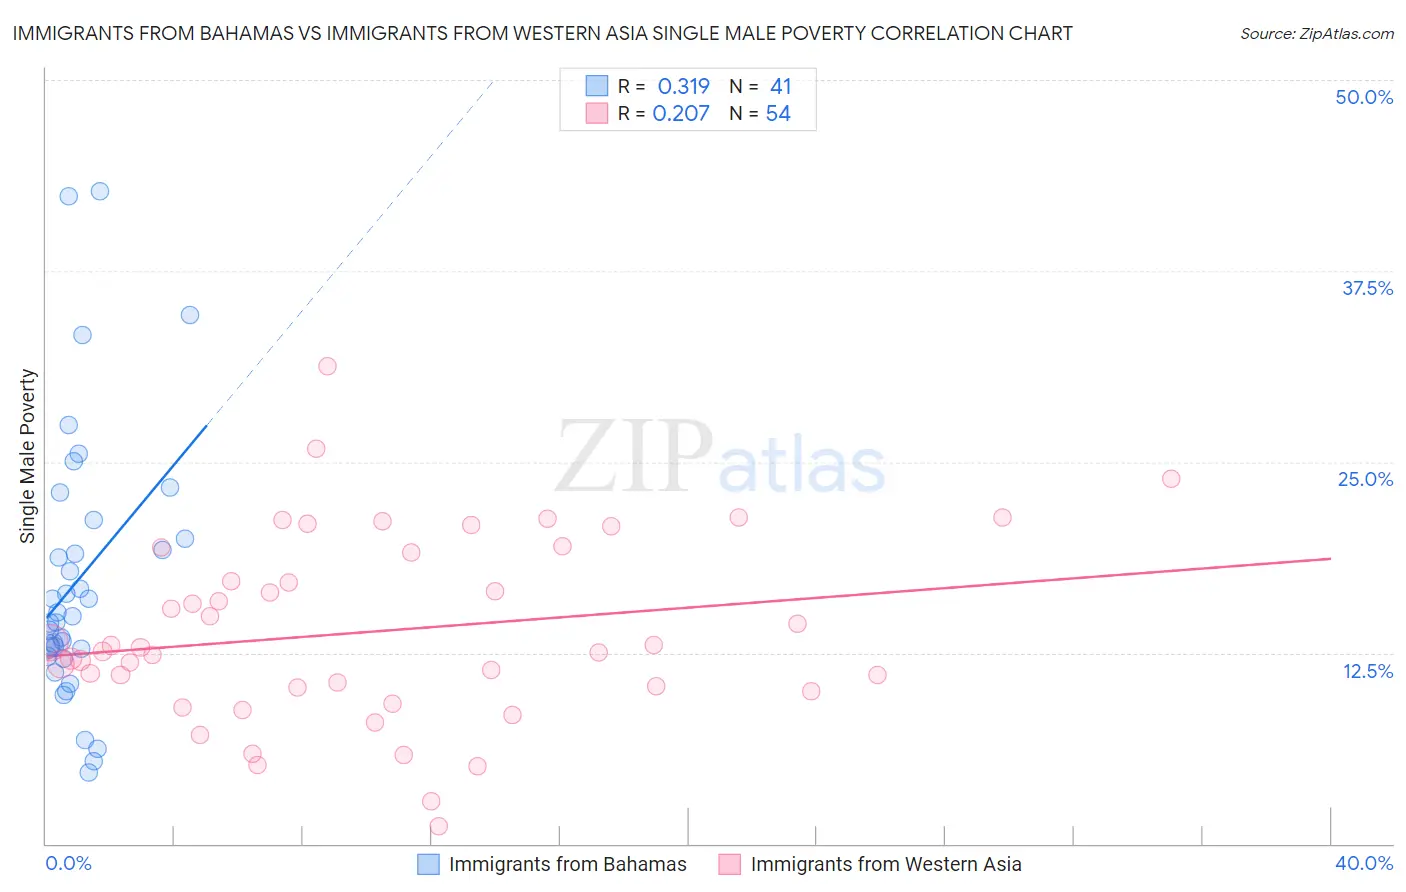
Immigrants from Bahamas vs Immigrants from Western Asia Single Male Poverty Correlation Chart
The statistical analysis conducted on geographies consisting of 101,111,257 people shows a mild positive correlation between the proportion of Immigrants from Bahamas and poverty level among single males in the United States with a correlation coefficient (R) of 0.319 and weighted average of 14.4%. Similarly, the statistical analysis conducted on geographies consisting of 356,365,100 people shows a weak positive correlation between the proportion of Immigrants from Western Asia and poverty level among single males in the United States with a correlation coefficient (R) of 0.207 and weighted average of 12.5%, a difference of 15.0%.
Single Male Poverty Correlation Summary
| Measurement | Immigrants from Bahamas | Immigrants from Western Asia |
| Minimum | 4.7% | 1.2% |
| Maximum | 42.7% | 31.2% |
| Range | 38.1% | 30.1% |
| Mean | 17.4% | 13.9% |
| Median | 14.9% | 12.7% |
| Interquartile 25% (IQ1) | 12.5% | 10.2% |
| Interquartile 75% (IQ3) | 20.6% | 19.0% |
| Interquartile Range (IQR) | 8.1% | 8.8% |
| Standard Deviation (Sample) | 8.8% | 6.1% |
| Standard Deviation (Population) | 8.7% | 6.0% |
Similar Demographics by Single Male Poverty
Demographics Similar to Immigrants from Bahamas by Single Male Poverty
In terms of single male poverty, the demographic groups most similar to Immigrants from Bahamas are French (14.4%, a difference of 0.13%), Celtic (14.5%, a difference of 0.46%), Iroquois (14.5%, a difference of 0.58%), White/Caucasian (14.5%, a difference of 0.59%), and Immigrants from Dominica (14.5%, a difference of 0.67%).
| Demographics | Rating | Rank | Single Male Poverty |
| Immigrants | Honduras | 0.0 /100 | #277 | Tragic 14.1% |
| Slovaks | 0.0 /100 | #278 | Tragic 14.1% |
| Indonesians | 0.0 /100 | #279 | Tragic 14.1% |
| Hmong | 0.0 /100 | #280 | Tragic 14.2% |
| Hispanics or Latinos | 0.0 /100 | #281 | Tragic 14.2% |
| Spanish Americans | 0.0 /100 | #282 | Tragic 14.2% |
| Yaqui | 0.0 /100 | #283 | Tragic 14.2% |
| Immigrants | Bahamas | 0.0 /100 | #284 | Tragic 14.4% |
| French | 0.0 /100 | #285 | Tragic 14.4% |
| Celtics | 0.0 /100 | #286 | Tragic 14.5% |
| Iroquois | 0.0 /100 | #287 | Tragic 14.5% |
| Whites/Caucasians | 0.0 /100 | #288 | Tragic 14.5% |
| Immigrants | Dominica | 0.0 /100 | #289 | Tragic 14.5% |
| U.S. Virgin Islanders | 0.0 /100 | #290 | Tragic 14.5% |
| Bahamians | 0.0 /100 | #291 | Tragic 14.6% |
Demographics Similar to Immigrants from Western Asia by Single Male Poverty
In terms of single male poverty, the demographic groups most similar to Immigrants from Western Asia are Immigrants from Northern Europe (12.5%, a difference of 0.030%), Salvadoran (12.5%, a difference of 0.030%), Immigrants from Ecuador (12.5%, a difference of 0.12%), Immigrants from Nicaragua (12.5%, a difference of 0.14%), and Immigrants from Costa Rica (12.5%, a difference of 0.14%).
| Demographics | Rating | Rank | Single Male Poverty |
| Romanians | 86.4 /100 | #126 | Excellent 12.5% |
| Immigrants | Netherlands | 86.2 /100 | #127 | Excellent 12.5% |
| Ecuadorians | 85.9 /100 | #128 | Excellent 12.5% |
| Immigrants | Sierra Leone | 85.5 /100 | #129 | Excellent 12.5% |
| Immigrants | Nicaragua | 84.8 /100 | #130 | Excellent 12.5% |
| Immigrants | Northern Europe | 83.7 /100 | #131 | Excellent 12.5% |
| Salvadorans | 83.7 /100 | #132 | Excellent 12.5% |
| Immigrants | Western Asia | 83.4 /100 | #133 | Excellent 12.5% |
| Immigrants | Ecuador | 82.1 /100 | #134 | Excellent 12.5% |
| Immigrants | Costa Rica | 81.9 /100 | #135 | Excellent 12.5% |
| Immigrants | Austria | 81.9 /100 | #136 | Excellent 12.5% |
| Ukrainians | 80.7 /100 | #137 | Excellent 12.6% |
| Immigrants | El Salvador | 80.0 /100 | #138 | Excellent 12.6% |
| Cubans | 79.9 /100 | #139 | Good 12.6% |
| Immigrants | Zimbabwe | 78.0 /100 | #140 | Good 12.6% |