Immigrants from Australia vs Bermudan Seniors Poverty Over the Age of 65
COMPARE
Immigrants from Australia
Bermudan
Seniors Poverty Over the Age of 65
Seniors Poverty Over the Age of 65 Comparison
Immigrants from Australia
Bermudans
10.5%
SENIORS POVERTY OVER THE AGE OF 65
85.1/ 100
METRIC RATING
137th/ 347
METRIC RANK
11.9%
SENIORS POVERTY OVER THE AGE OF 65
2.1/ 100
METRIC RATING
230th/ 347
METRIC RANK
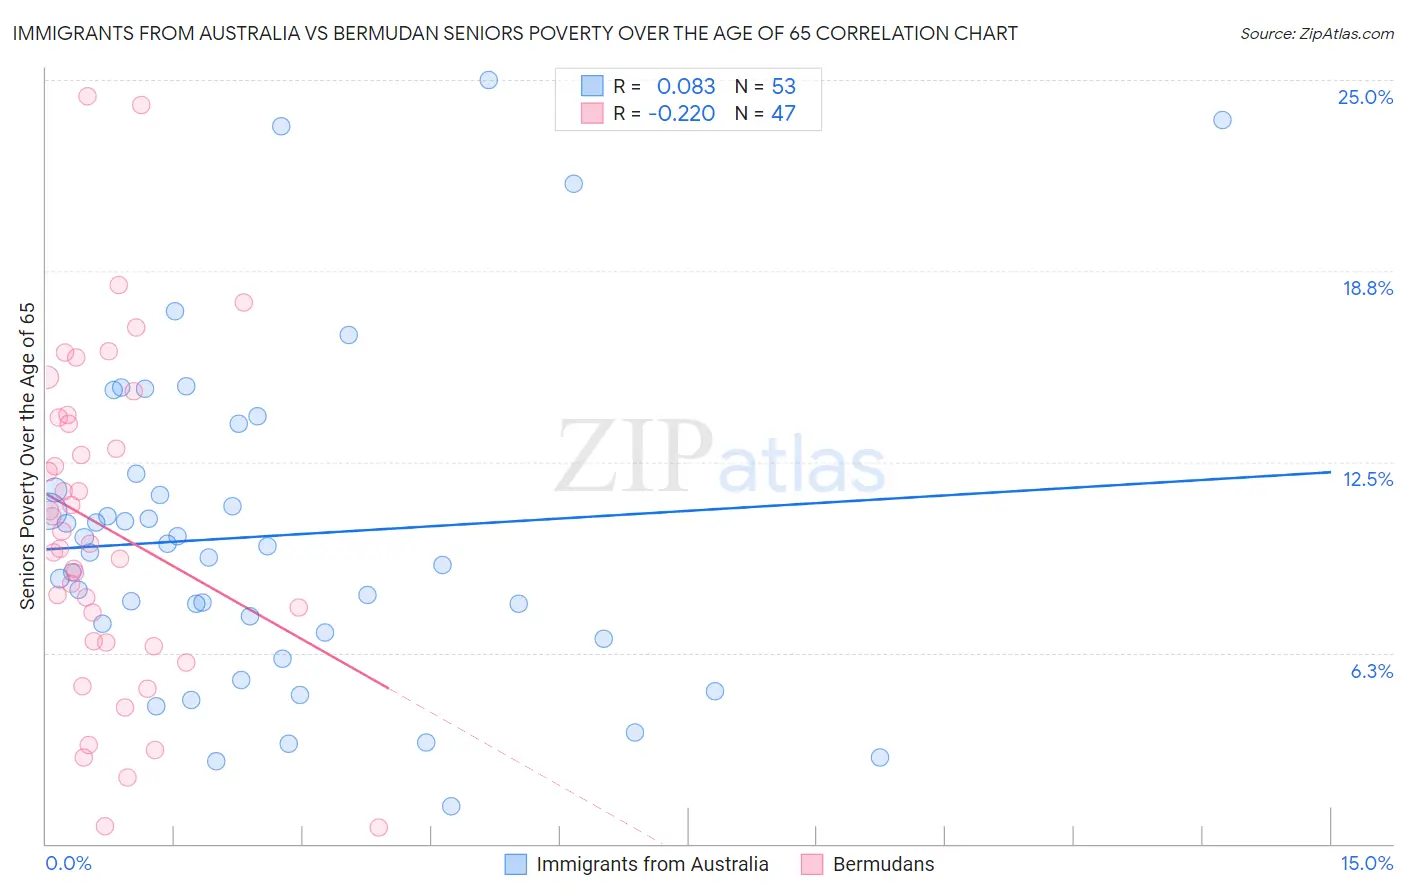
Immigrants from Australia vs Bermudan Seniors Poverty Over the Age of 65 Correlation Chart
The statistical analysis conducted on geographies consisting of 226,798,964 people shows a slight positive correlation between the proportion of Immigrants from Australia and poverty level among seniors over the age of 65 in the United States with a correlation coefficient (R) of 0.083 and weighted average of 10.5%. Similarly, the statistical analysis conducted on geographies consisting of 55,699,016 people shows a weak negative correlation between the proportion of Bermudans and poverty level among seniors over the age of 65 in the United States with a correlation coefficient (R) of -0.220 and weighted average of 11.9%, a difference of 12.9%.
Seniors Poverty Over the Age of 65 Correlation Summary
| Measurement | Immigrants from Australia | Bermudan |
| Minimum | 1.2% | 0.55% |
| Maximum | 25.0% | 24.5% |
| Range | 23.8% | 23.9% |
| Mean | 10.1% | 10.4% |
| Median | 9.5% | 9.8% |
| Interquartile 25% (IQ1) | 6.8% | 6.6% |
| Interquartile 75% (IQ3) | 11.9% | 14.0% |
| Interquartile Range (IQR) | 5.0% | 7.4% |
| Standard Deviation (Sample) | 5.4% | 5.4% |
| Standard Deviation (Population) | 5.3% | 5.4% |
Similar Demographics by Seniors Poverty Over the Age of 65
Demographics Similar to Immigrants from Australia by Seniors Poverty Over the Age of 65
In terms of seniors poverty over the age of 65, the demographic groups most similar to Immigrants from Australia are Immigrants from Latvia (10.5%, a difference of 0.060%), Portuguese (10.5%, a difference of 0.16%), Immigrants from Serbia (10.5%, a difference of 0.26%), Immigrants from Norway (10.5%, a difference of 0.27%), and Immigrants from Kenya (10.5%, a difference of 0.29%).
| Demographics | Rating | Rank | Seniors Poverty Over the Age of 65 |
| Immigrants | Oceania | 88.4 /100 | #130 | Excellent 10.4% |
| Egyptians | 87.8 /100 | #131 | Excellent 10.5% |
| Immigrants | Turkey | 87.7 /100 | #132 | Excellent 10.5% |
| Guamanians/Chamorros | 87.5 /100 | #133 | Excellent 10.5% |
| Sierra Leoneans | 86.8 /100 | #134 | Excellent 10.5% |
| Immigrants | Norway | 86.5 /100 | #135 | Excellent 10.5% |
| Immigrants | Serbia | 86.4 /100 | #136 | Excellent 10.5% |
| Immigrants | Australia | 85.1 /100 | #137 | Excellent 10.5% |
| Immigrants | Latvia | 84.7 /100 | #138 | Excellent 10.5% |
| Portuguese | 84.1 /100 | #139 | Excellent 10.5% |
| Immigrants | Kenya | 83.4 /100 | #140 | Excellent 10.5% |
| Immigrants | Europe | 83.3 /100 | #141 | Excellent 10.5% |
| Osage | 82.8 /100 | #142 | Excellent 10.6% |
| Immigrants | Asia | 80.8 /100 | #143 | Excellent 10.6% |
| Iraqis | 80.7 /100 | #144 | Excellent 10.6% |
Demographics Similar to Bermudans by Seniors Poverty Over the Age of 65
In terms of seniors poverty over the age of 65, the demographic groups most similar to Bermudans are Cajun (11.9%, a difference of 0.050%), Yaqui (11.9%, a difference of 0.19%), Panamanian (11.9%, a difference of 0.29%), Iroquois (11.9%, a difference of 0.38%), and Immigrants from Eritrea (11.8%, a difference of 0.50%).
| Demographics | Rating | Rank | Seniors Poverty Over the Age of 65 |
| Immigrants | Congo | 3.8 /100 | #223 | Tragic 11.7% |
| Immigrants | Nigeria | 3.4 /100 | #224 | Tragic 11.7% |
| Immigrants | Belarus | 3.2 /100 | #225 | Tragic 11.8% |
| Liberians | 3.2 /100 | #226 | Tragic 11.8% |
| Nigerians | 3.2 /100 | #227 | Tragic 11.8% |
| Immigrants | Costa Rica | 2.7 /100 | #228 | Tragic 11.8% |
| Immigrants | Eritrea | 2.6 /100 | #229 | Tragic 11.8% |
| Bermudans | 2.1 /100 | #230 | Tragic 11.9% |
| Cajuns | 2.0 /100 | #231 | Tragic 11.9% |
| Yaqui | 1.9 /100 | #232 | Tragic 11.9% |
| Panamanians | 1.8 /100 | #233 | Tragic 11.9% |
| Iroquois | 1.7 /100 | #234 | Tragic 11.9% |
| Immigrants | Argentina | 1.3 /100 | #235 | Tragic 12.0% |
| Immigrants | Peru | 1.3 /100 | #236 | Tragic 12.0% |
| Moroccans | 1.2 /100 | #237 | Tragic 12.0% |