Immigrants from Argentina vs Immigrants from Barbados Female Poverty Among 25-34 Year Olds

COMPARE

Immigrants from Argentina
Race
Ancestry
AfghanAfricanAlaska NativeAlaskan AthabascanAlbanianAleutAlsatianAmericanApacheArabArapahoArgentineanArmenianAssyrian/Chaldean/SyriacAustralianAustrianBahamianBangladeshiBarbadianBasqueBelgianBelizeanBermudanBhutaneseBlackfeetBolivianBrazilianBritishBritish West IndianBulgarianBurmeseCajunCambodianCanadianCape VerdeanCarpatho RusynCelticCentral AmericanCentral American IndianCherokeeCheyenneChickasawChileanChineseChippewaChoctawColombianColvilleComancheCosta RicanCreeCreekCroatianCrowCubanCypriotCzechCzechoslovakianDanishDelawareDominicanDutchDutch West IndianEastern EuropeanEcuadorianEgyptianEnglishEstonianEthiopianEuropeanFijianFilipinoFinnishFrenchFrench American IndianFrench CanadianGermanGerman RussianGhanaianGreekGuamanian/ChamorroGuatemalanGuyaneseHaitianHmongHonduranHopiHoumaHungarianIcelanderIndian (Asian)IndonesianInupiatIranianIraqiIrishIroquoisIsraeliItalianJamaicanJapaneseJordanianKenyanKiowaKoreanLaotianLatvianLebaneseLiberianLithuanianLumbeeLuxembourgerMacedonianMalaysianMalteseMarshalleseMenomineeMexicanMexican American IndianMongolianMoroccanNative HawaiianNavajoNepaleseNew ZealanderNicaraguanNigerianNorthern EuropeanNorwegianOkinawanOsageOttawaPaiutePakistaniPalestinianPanamanianParaguayanPennsylvania GermanPeruvianPimaPolishPortuguesePotawatomiPuebloPuerto RicanPuget Sound SalishRomanianRussianSalvadoranSamoanScandinavianScotch-IrishScottishSeminoleSenegaleseSerbianShoshoneSierra LeoneanSiouxSlavicSlovakSloveneSomaliSouth AfricanSouth AmericanSouth American IndianSoviet UnionSpaniardSpanishSpanish AmericanSpanish American IndianSri LankanSubsaharan AfricanSudaneseSwedishSwissSyrianTaiwaneseThaiTlingit-HaidaTohono O'OdhamTonganTrinidadian and TobagonianTsimshianTurkishU.S. Virgin IslanderUgandanUkrainianUruguayanUteVenezuelanVietnameseWelshWest IndianYakamaYaquiYugoslavianYumanYup'ikZimbabwean
Immigration
NonimmigrantsImmigrantsAfghanistanAfricaAlbaniaArgentinaArmeniaAsiaAustraliaAustriaBahamasBangladeshBelarusBelgiumBelizeBoliviaBosnia and HerzegovinaBrazilBulgariaBurma/MyanmarCabo VerdeCambodiaCameroonCanadaCaribbeanCentral AmericaChileChinaColombiaCongoCosta RicaCroatiaCubaCzechoslovakiaDenmarkDominicaDominican RepublicEastern AfricaEastern AsiaEastern EuropeEcuadorEgyptEl SalvadorEnglandEritreaEthiopiaEuropeFijiFranceGermanyGhanaGreeceGrenadaGuatemalaGuyanaHaitiHondurasHong KongHungaryIndiaIndonesiaIranIraqIrelandIsraelItalyJamaicaJapanJordanKazakhstanKenyaKoreaKuwaitLaosLatin AmericaLatviaLebanonLiberiaLithuaniaMalaysiaMexicoMicronesiaMiddle AfricaMoldovaMoroccoNepalNetherlandsNicaraguaNigeriaNorth AmericaNorth MacedoniaNorthern AfricaNorthern EuropeNorwayOceaniaPakistanPanamaPeruPhilippinesPolandPortugalRomaniaRussiaSaudi ArabiaScotlandSenegalSerbiaSierra LeoneSingaporeSomaliaSouth AfricaSouth AmericaSouth Central AsiaSouth Eastern AsiaSouthern EuropeSpainSri LankaSt. Vincent and the GrenadinesSudanSwedenSwitzerlandSyriaTaiwanThailandTrinidad and TobagoTurkeyUgandaUkraineUruguayUzbekistanVenezuelaVietnamWest IndiesWestern AfricaWestern AsiaWestern EuropeYemenZaireZimbabweAzores
Immigrants from Barbados
Race
Ancestry
AfghanAfricanAlaska NativeAlaskan AthabascanAlbanianAleutAlsatianAmericanApacheArabArapahoArgentineanArmenianAssyrian/Chaldean/SyriacAustralianAustrianBahamianBangladeshiBarbadianBasqueBelgianBelizeanBermudanBhutaneseBlackfeetBolivianBrazilianBritishBritish West IndianBulgarianBurmeseCajunCambodianCanadianCape VerdeanCarpatho RusynCelticCentral AmericanCentral American IndianCherokeeCheyenneChickasawChileanChineseChippewaChoctawColombianColvilleComancheCosta RicanCreeCreekCroatianCrowCubanCypriotCzechCzechoslovakianDanishDelawareDominicanDutchDutch West IndianEastern EuropeanEcuadorianEgyptianEnglishEstonianEthiopianEuropeanFijianFilipinoFinnishFrenchFrench American IndianFrench CanadianGermanGerman RussianGhanaianGreekGuamanian/ChamorroGuatemalanGuyaneseHaitianHmongHonduranHopiHoumaHungarianIcelanderIndian (Asian)IndonesianInupiatIranianIraqiIrishIroquoisIsraeliItalianJamaicanJapaneseJordanianKenyanKiowaKoreanLaotianLatvianLebaneseLiberianLithuanianLumbeeLuxembourgerMacedonianMalaysianMalteseMarshalleseMenomineeMexicanMexican American IndianMongolianMoroccanNative HawaiianNavajoNepaleseNew ZealanderNicaraguanNigerianNorthern EuropeanNorwegianOkinawanOsageOttawaPaiutePakistaniPalestinianPanamanianParaguayanPennsylvania GermanPeruvianPimaPolishPortuguesePotawatomiPuebloPuerto RicanPuget Sound SalishRomanianRussianSalvadoranSamoanScandinavianScotch-IrishScottishSeminoleSenegaleseSerbianShoshoneSierra LeoneanSiouxSlavicSlovakSloveneSomaliSouth AfricanSouth AmericanSouth American IndianSoviet UnionSpaniardSpanishSpanish AmericanSpanish American IndianSri LankanSubsaharan AfricanSudaneseSwedishSwissSyrianTaiwaneseThaiTlingit-HaidaTohono O'OdhamTonganTrinidadian and TobagonianTsimshianTurkishU.S. Virgin IslanderUgandanUkrainianUruguayanUteVenezuelanVietnameseWelshWest IndianYakamaYaquiYugoslavianYumanYup'ikZimbabwean
Immigration
NonimmigrantsImmigrantsAfghanistanAfricaAlbaniaArmeniaAsiaAustraliaAustriaBahamasBangladeshBarbadosBelarusBelgiumBelizeBoliviaBosnia and HerzegovinaBrazilBulgariaBurma/MyanmarCabo VerdeCambodiaCameroonCanadaCaribbeanCentral AmericaChileChinaColombiaCongoCosta RicaCroatiaCubaCzechoslovakiaDenmarkDominicaDominican RepublicEastern AfricaEastern AsiaEastern EuropeEcuadorEgyptEl SalvadorEnglandEritreaEthiopiaEuropeFijiFranceGermanyGhanaGreeceGrenadaGuatemalaGuyanaHaitiHondurasHong KongHungaryIndiaIndonesiaIranIraqIrelandIsraelItalyJamaicaJapanJordanKazakhstanKenyaKoreaKuwaitLaosLatin AmericaLatviaLebanonLiberiaLithuaniaMalaysiaMexicoMicronesiaMiddle AfricaMoldovaMoroccoNepalNetherlandsNicaraguaNigeriaNorth AmericaNorth MacedoniaNorthern AfricaNorthern EuropeNorwayOceaniaPakistanPanamaPeruPhilippinesPolandPortugalRomaniaRussiaSaudi ArabiaScotlandSenegalSerbiaSierra LeoneSingaporeSomaliaSouth AfricaSouth AmericaSouth Central AsiaSouth Eastern AsiaSouthern EuropeSpainSri LankaSt. Vincent and the GrenadinesSudanSwedenSwitzerlandSyriaTaiwanThailandTrinidad and TobagoTurkeyUgandaUkraineUruguayUzbekistanVenezuelaVietnamWest IndiesWestern AfricaWestern AsiaWestern EuropeYemenZaireZimbabweAzores
Female Poverty Among 25-34 Year Olds
Income
Poverty
Unemployment
Labor Participation
Family Structure
Vehicle Availability
Education Level
Disability

Female Poverty Among 25-34 Year Olds Comparison

Immigrants from Argentina

Immigrants from Barbados

Exceptional
Tragic
12.6%
FEMALE POVERTY AMONG 25-34 YEAR OLDS
96.4/ 100
METRIC RATING
99th/ 347
METRIC RANK
14.5%
FEMALE POVERTY AMONG 25-34 YEAR OLDS
3.4/ 100
METRIC RATING
225th/ 347
METRIC RANK

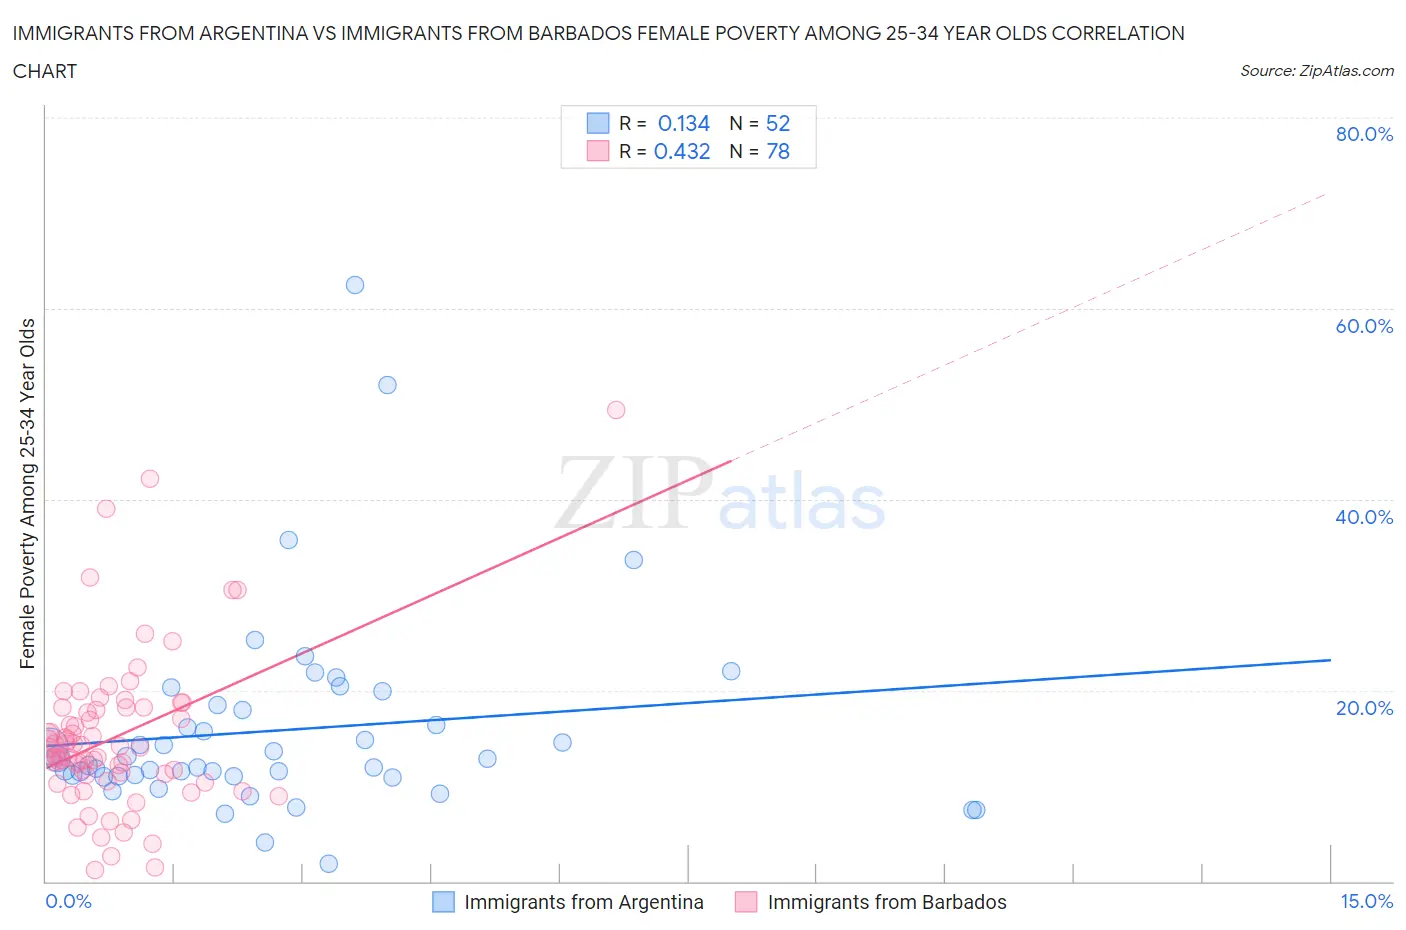
Immigrants from Argentina vs Immigrants from Barbados Female Poverty Among 25-34 Year Olds Correlation Chart

The statistical analysis conducted on geographies consisting of 261,759,326 people shows a poor positive correlation between the proportion of Immigrants from Argentina and poverty level among females between the ages 25 and 34 in the United States with a correlation coefficient (R) of 0.134 and weighted average of 12.6%. Similarly, the statistical analysis conducted on geographies consisting of 112,289,086 people shows a moderate positive correlation between the proportion of Immigrants from Barbados and poverty level among females between the ages 25 and 34 in the United States with a correlation coefficient (R) of 0.432 and weighted average of 14.5%, a difference of 14.8%.
Immigrants from Argentina vs Immigrants from Barbados Female Poverty Among 25-34 Year Olds

Female Poverty Among 25-34 Year Olds Correlation Summary

MeasurementImmigrants from ArgentinaImmigrants from Barbados
Minimum1.8%1.1%
Maximum62.5%49.4%
Range60.7%48.3%
Mean15.8%15.1%
Median12.5%14.0%
Interquartile 25% (IQ1)11.0%11.1%
Interquartile 75% (IQ3)18.2%18.2%
Interquartile Range (IQR)7.2%7.1%
Standard Deviation (Sample)10.5%8.3%
Standard Deviation (Population)10.4%8.3%

Similar Demographics by Female Poverty Among 25-34 Year Olds

Demographics Similar to Immigrants from Argentina by Female Poverty Among 25-34 Year Olds

In terms of female poverty among 25-34 year olds, the demographic groups most similar to Immigrants from Argentina are Immigrants from Northern Africa (12.6%, a difference of 0.11%), Immigrants from Ethiopia (12.6%, a difference of 0.11%), Immigrants from Zimbabwe (12.6%, a difference of 0.23%), Ukrainian (12.6%, a difference of 0.24%), and Immigrants from France (12.6%, a difference of 0.28%).
DemographicsRating | RankFemale Poverty Among 25-34 Year Olds
Immigrants | Armenia
96.9
/100
|
#92
Exceptional
12.6%
Palestinians
96.9
/100
|
#93
Exceptional
12.6%
Immigrants | France
96.8
/100
|
#94
Exceptional
12.6%
Ukrainians
96.7
/100
|
#95
Exceptional
12.6%
Immigrants | Zimbabwe
96.7
/100
|
#96
Exceptional
12.6%
Immigrants | Northern Africa
96.6
/100
|
#97
Exceptional
12.6%
Immigrants | Ethiopia
96.5
/100
|
#98
Exceptional
12.6%
Immigrants | Argentina
96.4
/100
|
#99
Exceptional
12.6%
Immigrants | Denmark
95.7
/100
|
#100
Exceptional
12.7%
Immigrants | Switzerland
95.7
/100
|
#101
Exceptional
12.7%
Peruvians
95.6
/100
|
#102
Exceptional
12.7%
Immigrants | Spain
95.5
/100
|
#103
Exceptional
12.7%
Swedes
95.4
/100
|
#104
Exceptional
12.7%
Immigrants | South Africa
95.3
/100
|
#105
Exceptional
12.7%
Tsimshian
95.1
/100
|
#106
Exceptional
12.7%

Demographics Similar to Immigrants from Barbados by Female Poverty Among 25-34 Year Olds

In terms of female poverty among 25-34 year olds, the demographic groups most similar to Immigrants from Barbados are Nicaraguan (14.5%, a difference of 0.080%), Immigrants from Sudan (14.4%, a difference of 0.32%), Celtic (14.5%, a difference of 0.38%), Nigerian (14.4%, a difference of 0.39%), and Immigrants from Portugal (14.4%, a difference of 0.46%).
DemographicsRating | RankFemale Poverty Among 25-34 Year Olds
Immigrants | Thailand
5.2
/100
|
#218
Tragic
14.3%
Ecuadorians
5.2
/100
|
#219
Tragic
14.3%
Ghanaians
4.8
/100
|
#220
Tragic
14.4%
Sudanese
4.4
/100
|
#221
Tragic
14.4%
Immigrants | Portugal
4.3
/100
|
#222
Tragic
14.4%
Nigerians
4.2
/100
|
#223
Tragic
14.4%
Immigrants | Sudan
4.0
/100
|
#224
Tragic
14.4%
Immigrants | Barbados
3.4
/100
|
#225
Tragic
14.5%
Nicaraguans
3.3
/100
|
#226
Tragic
14.5%
Celtics
2.8
/100
|
#227
Tragic
14.5%
Vietnamese
2.6
/100
|
#228
Tragic
14.6%
Spanish
2.5
/100
|
#229
Tragic
14.6%
Spaniards
2.3
/100
|
#230
Tragic
14.6%
Delaware
2.3
/100
|
#231
Tragic
14.6%
Immigrants | Ecuador
1.9
/100
|
#232
Tragic
14.6%