Immigrants from Argentina vs Irish Seniors Poverty Over the Age of 75
COMPARE
Immigrants from Argentina
Irish
Seniors Poverty Over the Age of 75
Seniors Poverty Over the Age of 75 Comparison
Immigrants from Argentina
Irish
13.7%
SENIORS POVERTY OVER THE AGE OF 75
0.3/ 100
METRIC RATING
252nd/ 347
METRIC RANK
10.7%
SENIORS POVERTY OVER THE AGE OF 75
99.8/ 100
METRIC RATING
28th/ 347
METRIC RANK
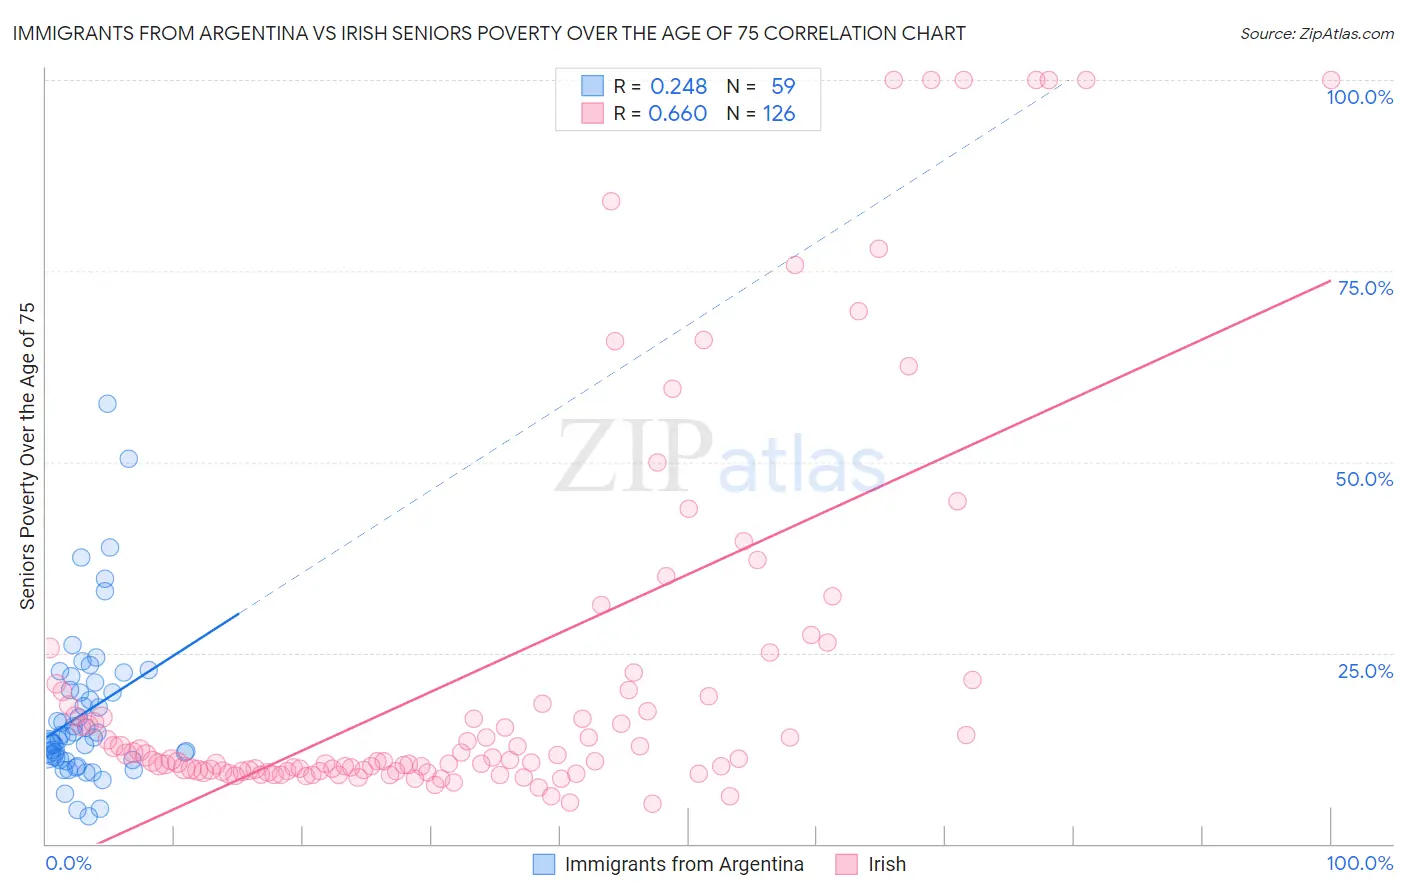
Immigrants from Argentina vs Irish Seniors Poverty Over the Age of 75 Correlation Chart
The statistical analysis conducted on geographies consisting of 262,394,450 people shows a weak positive correlation between the proportion of Immigrants from Argentina and poverty level among seniors over the age of 75 in the United States with a correlation coefficient (R) of 0.248 and weighted average of 13.7%. Similarly, the statistical analysis conducted on geographies consisting of 560,822,051 people shows a significant positive correlation between the proportion of Irish and poverty level among seniors over the age of 75 in the United States with a correlation coefficient (R) of 0.660 and weighted average of 10.7%, a difference of 27.9%.
Seniors Poverty Over the Age of 75 Correlation Summary
| Measurement | Immigrants from Argentina | Irish |
| Minimum | 3.5% | 5.2% |
| Maximum | 57.7% | 100.0% |
| Range | 54.2% | 94.8% |
| Mean | 17.2% | 22.4% |
| Median | 14.2% | 11.1% |
| Interquartile 25% (IQ1) | 11.0% | 9.5% |
| Interquartile 75% (IQ3) | 21.1% | 19.9% |
| Interquartile Range (IQR) | 10.0% | 10.4% |
| Standard Deviation (Sample) | 10.3% | 24.7% |
| Standard Deviation (Population) | 10.2% | 24.6% |
Similar Demographics by Seniors Poverty Over the Age of 75
Demographics Similar to Immigrants from Argentina by Seniors Poverty Over the Age of 75
In terms of seniors poverty over the age of 75, the demographic groups most similar to Immigrants from Argentina are Immigrants from Peru (13.7%, a difference of 0.050%), Immigrants from Spain (13.7%, a difference of 0.22%), Blackfeet (13.7%, a difference of 0.33%), Mexican American Indian (13.6%, a difference of 0.38%), and Immigrants from Albania (13.6%, a difference of 0.39%).
| Demographics | Rating | Rank | Seniors Poverty Over the Age of 75 |
| Uruguayans | 0.5 /100 | #245 | Tragic 13.5% |
| Immigrants | Cambodia | 0.4 /100 | #246 | Tragic 13.6% |
| Immigrants | Ukraine | 0.3 /100 | #247 | Tragic 13.6% |
| Africans | 0.3 /100 | #248 | Tragic 13.6% |
| Immigrants | Albania | 0.3 /100 | #249 | Tragic 13.6% |
| Mexican American Indians | 0.3 /100 | #250 | Tragic 13.6% |
| Immigrants | Peru | 0.3 /100 | #251 | Tragic 13.7% |
| Immigrants | Argentina | 0.3 /100 | #252 | Tragic 13.7% |
| Immigrants | Spain | 0.2 /100 | #253 | Tragic 13.7% |
| Blackfeet | 0.2 /100 | #254 | Tragic 13.7% |
| Immigrants | Belarus | 0.2 /100 | #255 | Tragic 13.8% |
| Inupiat | 0.1 /100 | #256 | Tragic 13.8% |
| Immigrants | Western Africa | 0.1 /100 | #257 | Tragic 13.9% |
| Immigrants | Panama | 0.1 /100 | #258 | Tragic 13.9% |
| Immigrants | Portugal | 0.1 /100 | #259 | Tragic 13.9% |
Demographics Similar to Irish by Seniors Poverty Over the Age of 75
In terms of seniors poverty over the age of 75, the demographic groups most similar to Irish are Northern European (10.7%, a difference of 0.060%), Assyrian/Chaldean/Syriac (10.7%, a difference of 0.15%), Swiss (10.7%, a difference of 0.23%), Bulgarian (10.7%, a difference of 0.33%), and Marshallese (10.7%, a difference of 0.41%).
| Demographics | Rating | Rank | Seniors Poverty Over the Age of 75 |
| Slovenes | 99.9 /100 | #21 | Exceptional 10.6% |
| Bhutanese | 99.8 /100 | #22 | Exceptional 10.6% |
| Lithuanians | 99.8 /100 | #23 | Exceptional 10.6% |
| Poles | 99.8 /100 | #24 | Exceptional 10.6% |
| Menominee | 99.8 /100 | #25 | Exceptional 10.6% |
| Bulgarians | 99.8 /100 | #26 | Exceptional 10.7% |
| Northern Europeans | 99.8 /100 | #27 | Exceptional 10.7% |
| Irish | 99.8 /100 | #28 | Exceptional 10.7% |
| Assyrians/Chaldeans/Syriacs | 99.8 /100 | #29 | Exceptional 10.7% |
| Swiss | 99.7 /100 | #30 | Exceptional 10.7% |
| Marshallese | 99.7 /100 | #31 | Exceptional 10.7% |
| British | 99.7 /100 | #32 | Exceptional 10.7% |
| Puget Sound Salish | 99.7 /100 | #33 | Exceptional 10.8% |
| Italians | 99.7 /100 | #34 | Exceptional 10.8% |
| Luxembourgers | 99.6 /100 | #35 | Exceptional 10.8% |