Immigrants from Albania vs Samoan Poverty
COMPARE
Immigrants from Albania
Samoan
Poverty
Poverty Comparison
Immigrants from Albania
Samoans
12.2%
POVERTY
57.7/ 100
METRIC RATING
165th/ 347
METRIC RANK
12.0%
POVERTY
71.9/ 100
METRIC RATING
151st/ 347
METRIC RANK
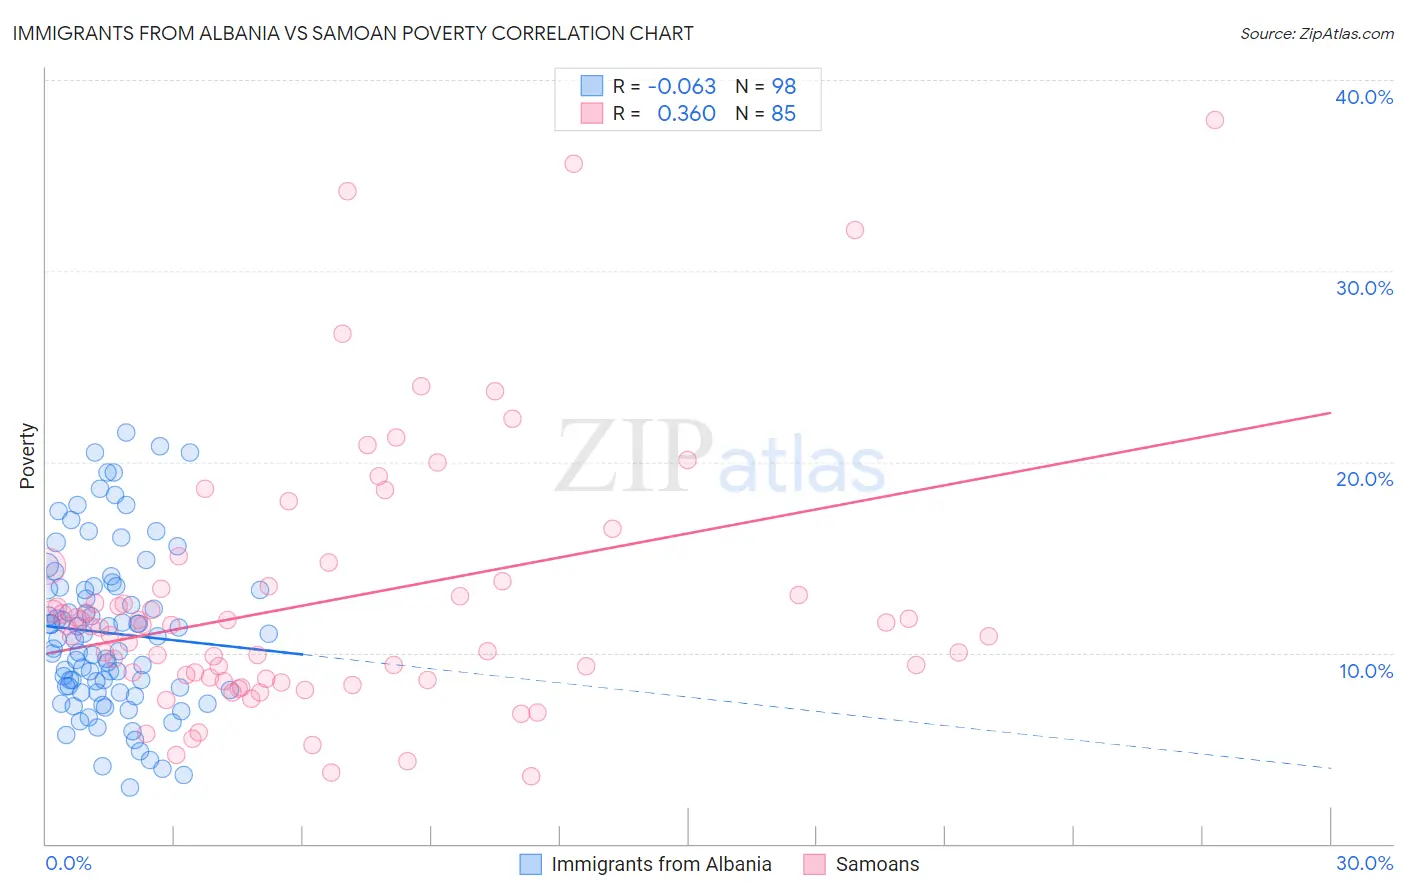
Immigrants from Albania vs Samoan Poverty Correlation Chart
The statistical analysis conducted on geographies consisting of 119,368,708 people shows a slight negative correlation between the proportion of Immigrants from Albania and poverty level in the United States with a correlation coefficient (R) of -0.063 and weighted average of 12.2%. Similarly, the statistical analysis conducted on geographies consisting of 225,074,148 people shows a mild positive correlation between the proportion of Samoans and poverty level in the United States with a correlation coefficient (R) of 0.360 and weighted average of 12.0%, a difference of 1.6%.
Poverty Correlation Summary
| Measurement | Immigrants from Albania | Samoan |
| Minimum | 3.0% | 3.5% |
| Maximum | 21.5% | 37.9% |
| Range | 18.6% | 34.4% |
| Mean | 11.0% | 12.7% |
| Median | 10.7% | 11.4% |
| Interquartile 25% (IQ1) | 8.0% | 8.6% |
| Interquartile 75% (IQ3) | 13.4% | 13.6% |
| Interquartile Range (IQR) | 5.4% | 5.0% |
| Standard Deviation (Sample) | 4.2% | 6.9% |
| Standard Deviation (Population) | 4.2% | 6.8% |
Demographics Similar to Immigrants from Albania and Samoans by Poverty
In terms of poverty, the demographic groups most similar to Immigrants from Albania are Colombian (12.2%, a difference of 0.010%), Immigrants from Ethiopia (12.2%, a difference of 0.080%), Venezuelan (12.2%, a difference of 0.090%), Immigrants from Chile (12.2%, a difference of 0.11%), and Immigrants from Venezuela (12.2%, a difference of 0.12%). Similarly, the demographic groups most similar to Samoans are Immigrants from Kazakhstan (12.0%, a difference of 0.040%), Immigrants from Malaysia (12.0%, a difference of 0.090%), Immigrants from Germany (12.0%, a difference of 0.10%), Armenian (12.1%, a difference of 0.50%), and Immigrants from Northern Africa (12.1%, a difference of 0.91%).
| Demographics | Rating | Rank | Poverty |
| Immigrants | Germany | 72.7 /100 | #148 | Good 12.0% |
| Immigrants | Malaysia | 72.7 /100 | #149 | Good 12.0% |
| Immigrants | Kazakhstan | 72.3 /100 | #150 | Good 12.0% |
| Samoans | 71.9 /100 | #151 | Good 12.0% |
| Armenians | 67.6 /100 | #152 | Good 12.1% |
| Immigrants | Northern Africa | 63.9 /100 | #153 | Good 12.1% |
| Guamanians/Chamorros | 63.9 /100 | #154 | Good 12.1% |
| Hungarians | 63.6 /100 | #155 | Good 12.2% |
| Scotch-Irish | 62.6 /100 | #156 | Good 12.2% |
| Costa Ricans | 62.2 /100 | #157 | Good 12.2% |
| Taiwanese | 61.8 /100 | #158 | Good 12.2% |
| Pennsylvania Germans | 60.8 /100 | #159 | Good 12.2% |
| Immigrants | Nepal | 60.4 /100 | #160 | Good 12.2% |
| Immigrants | Fiji | 59.1 /100 | #161 | Average 12.2% |
| Ethiopians | 59.1 /100 | #162 | Average 12.2% |
| Immigrants | Ethiopia | 58.6 /100 | #163 | Average 12.2% |
| Colombians | 57.8 /100 | #164 | Average 12.2% |
| Immigrants | Albania | 57.7 /100 | #165 | Average 12.2% |
| Venezuelans | 56.9 /100 | #166 | Average 12.2% |
| Immigrants | Chile | 56.7 /100 | #167 | Average 12.2% |
| Immigrants | Venezuela | 56.5 /100 | #168 | Average 12.2% |