Immigrants from Africa vs Immigrants from Netherlands Householder Income Ages 45 - 64 years
COMPARE
Immigrants from Africa
Immigrants from Netherlands
Householder Income Ages 45 - 64 years
Householder Income Ages 45 - 64 years Comparison
Immigrants from Africa
Immigrants from Netherlands
$97,284
HOUSEHOLDER INCOME AGES 45 - 64 YEARS
17.9/ 100
METRIC RATING
206th/ 347
METRIC RANK
$111,982
HOUSEHOLDER INCOME AGES 45 - 64 YEARS
99.7/ 100
METRIC RATING
60th/ 347
METRIC RANK
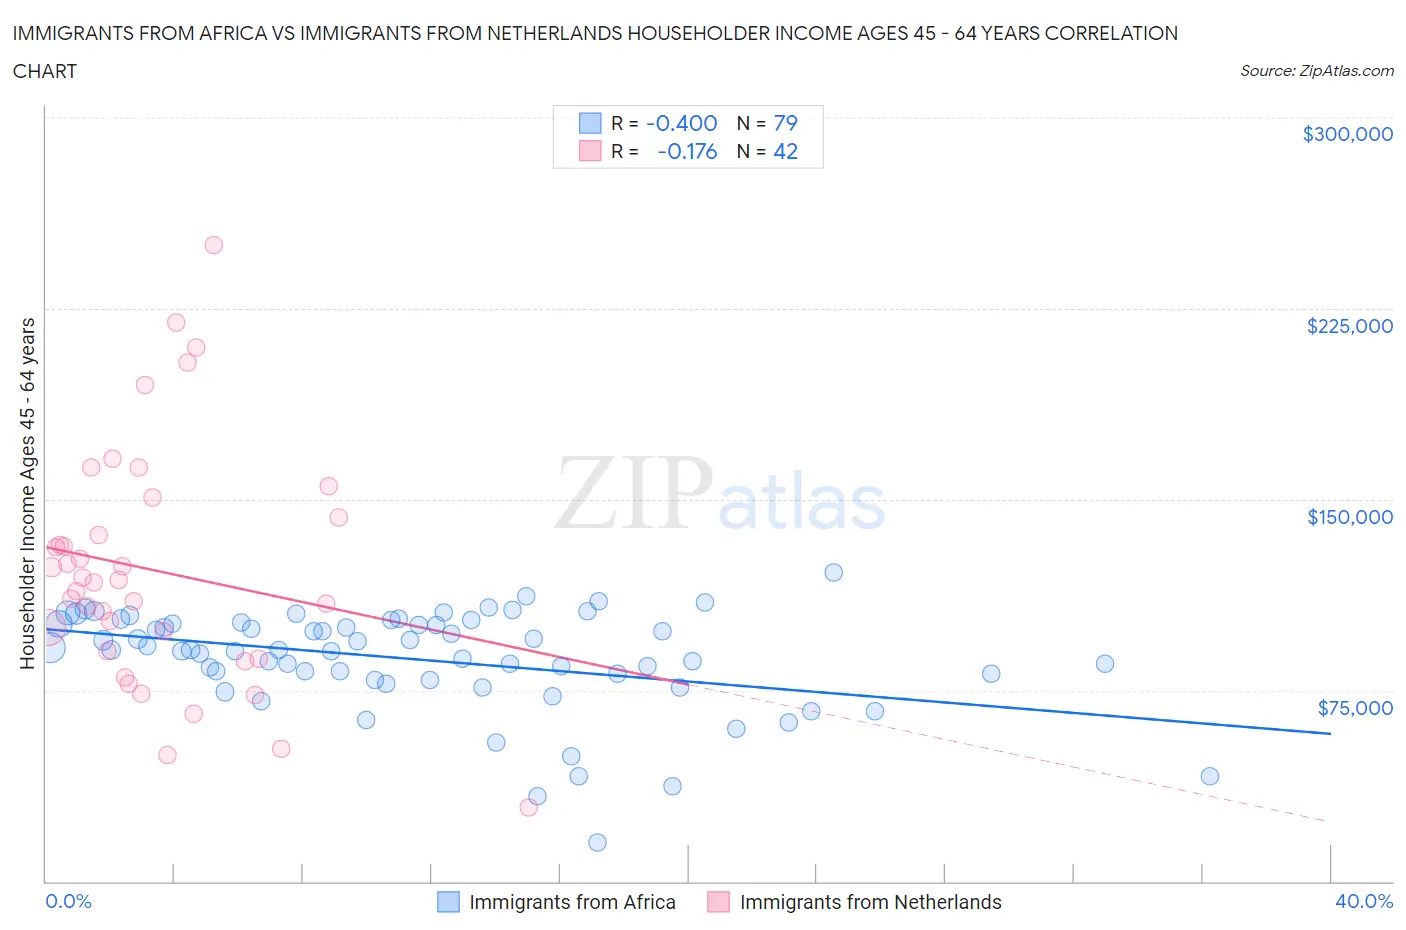
Immigrants from Africa vs Immigrants from Netherlands Householder Income Ages 45 - 64 years Correlation Chart
The statistical analysis conducted on geographies consisting of 468,209,620 people shows a moderate negative correlation between the proportion of Immigrants from Africa and household income with householder between the ages 45 and 64 in the United States with a correlation coefficient (R) of -0.400 and weighted average of $97,284. Similarly, the statistical analysis conducted on geographies consisting of 237,641,148 people shows a poor negative correlation between the proportion of Immigrants from Netherlands and household income with householder between the ages 45 and 64 in the United States with a correlation coefficient (R) of -0.176 and weighted average of $111,982, a difference of 15.1%.
Householder Income Ages 45 - 64 years Correlation Summary
| Measurement | Immigrants from Africa | Immigrants from Netherlands |
| Minimum | $15,339 | $28,859 |
| Maximum | $121,471 | $250,001 |
| Range | $106,132 | $221,142 |
| Mean | $87,158 | $122,033 |
| Median | $90,734 | $117,805 |
| Interquartile 25% (IQ1) | $79,112 | $90,138 |
| Interquartile 75% (IQ3) | $101,299 | $142,813 |
| Interquartile Range (IQR) | $22,188 | $52,675 |
| Standard Deviation (Sample) | $19,978 | $46,842 |
| Standard Deviation (Population) | $19,851 | $46,281 |
Similar Demographics by Householder Income Ages 45 - 64 years
Demographics Similar to Immigrants from Africa by Householder Income Ages 45 - 64 years
In terms of householder income ages 45 - 64 years, the demographic groups most similar to Immigrants from Africa are Immigrants from Colombia ($97,290, a difference of 0.010%), Ghanaian ($97,277, a difference of 0.010%), Immigrants from Eritrea ($97,373, a difference of 0.090%), Immigrants from Thailand ($97,400, a difference of 0.12%), and Tlingit-Haida ($97,417, a difference of 0.14%).
| Demographics | Rating | Rank | Householder Income Ages 45 - 64 years |
| Whites/Caucasians | 24.6 /100 | #199 | Fair $98,091 |
| Immigrants | Kenya | 23.5 /100 | #200 | Fair $97,964 |
| Yugoslavians | 20.0 /100 | #201 | Fair $97,558 |
| Tlingit-Haida | 18.9 /100 | #202 | Poor $97,417 |
| Immigrants | Thailand | 18.8 /100 | #203 | Poor $97,400 |
| Immigrants | Eritrea | 18.6 /100 | #204 | Poor $97,373 |
| Immigrants | Colombia | 18.0 /100 | #205 | Poor $97,290 |
| Immigrants | Africa | 17.9 /100 | #206 | Poor $97,284 |
| Ghanaians | 17.9 /100 | #207 | Poor $97,277 |
| Scotch-Irish | 16.4 /100 | #208 | Poor $97,073 |
| Japanese | 14.8 /100 | #209 | Poor $96,834 |
| Tsimshian | 14.5 /100 | #210 | Poor $96,783 |
| Immigrants | Cambodia | 13.0 /100 | #211 | Poor $96,537 |
| Venezuelans | 12.6 /100 | #212 | Poor $96,460 |
| Immigrants | Uruguay | 10.7 /100 | #213 | Poor $96,086 |
Demographics Similar to Immigrants from Netherlands by Householder Income Ages 45 - 64 years
In terms of householder income ages 45 - 64 years, the demographic groups most similar to Immigrants from Netherlands are Immigrants from Europe ($111,984, a difference of 0.0%), Soviet Union ($112,008, a difference of 0.020%), Immigrants from Czechoslovakia ($111,914, a difference of 0.060%), Immigrants from Scotland ($112,175, a difference of 0.17%), and Egyptian ($112,256, a difference of 0.24%).
| Demographics | Rating | Rank | Householder Income Ages 45 - 64 years |
| Afghans | 99.8 /100 | #53 | Exceptional $112,676 |
| Greeks | 99.8 /100 | #54 | Exceptional $112,630 |
| Lithuanians | 99.8 /100 | #55 | Exceptional $112,484 |
| Egyptians | 99.7 /100 | #56 | Exceptional $112,256 |
| Immigrants | Scotland | 99.7 /100 | #57 | Exceptional $112,175 |
| Soviet Union | 99.7 /100 | #58 | Exceptional $112,008 |
| Immigrants | Europe | 99.7 /100 | #59 | Exceptional $111,984 |
| Immigrants | Netherlands | 99.7 /100 | #60 | Exceptional $111,982 |
| Immigrants | Czechoslovakia | 99.7 /100 | #61 | Exceptional $111,914 |
| Immigrants | Norway | 99.7 /100 | #62 | Exceptional $111,669 |
| Mongolians | 99.6 /100 | #63 | Exceptional $111,602 |
| Immigrants | Latvia | 99.6 /100 | #64 | Exceptional $111,454 |
| Immigrants | Belarus | 99.6 /100 | #65 | Exceptional $111,430 |
| New Zealanders | 99.6 /100 | #66 | Exceptional $111,286 |
| Laotians | 99.5 /100 | #67 | Exceptional $111,051 |