Houma vs Immigrants from Austria Female Poverty Among 18-24 Year Olds
COMPARE
Houma
Immigrants from Austria
Female Poverty Among 18-24 Year Olds
Female Poverty Among 18-24 Year Olds Comparison
Houma
Immigrants from Austria
26.2%
FEMALE POVERTY AMONG 18-24 YEAR OLDS
0.0/ 100
METRIC RATING
332nd/ 347
METRIC RANK
19.7%
FEMALE POVERTY AMONG 18-24 YEAR OLDS
83.1/ 100
METRIC RATING
147th/ 347
METRIC RANK
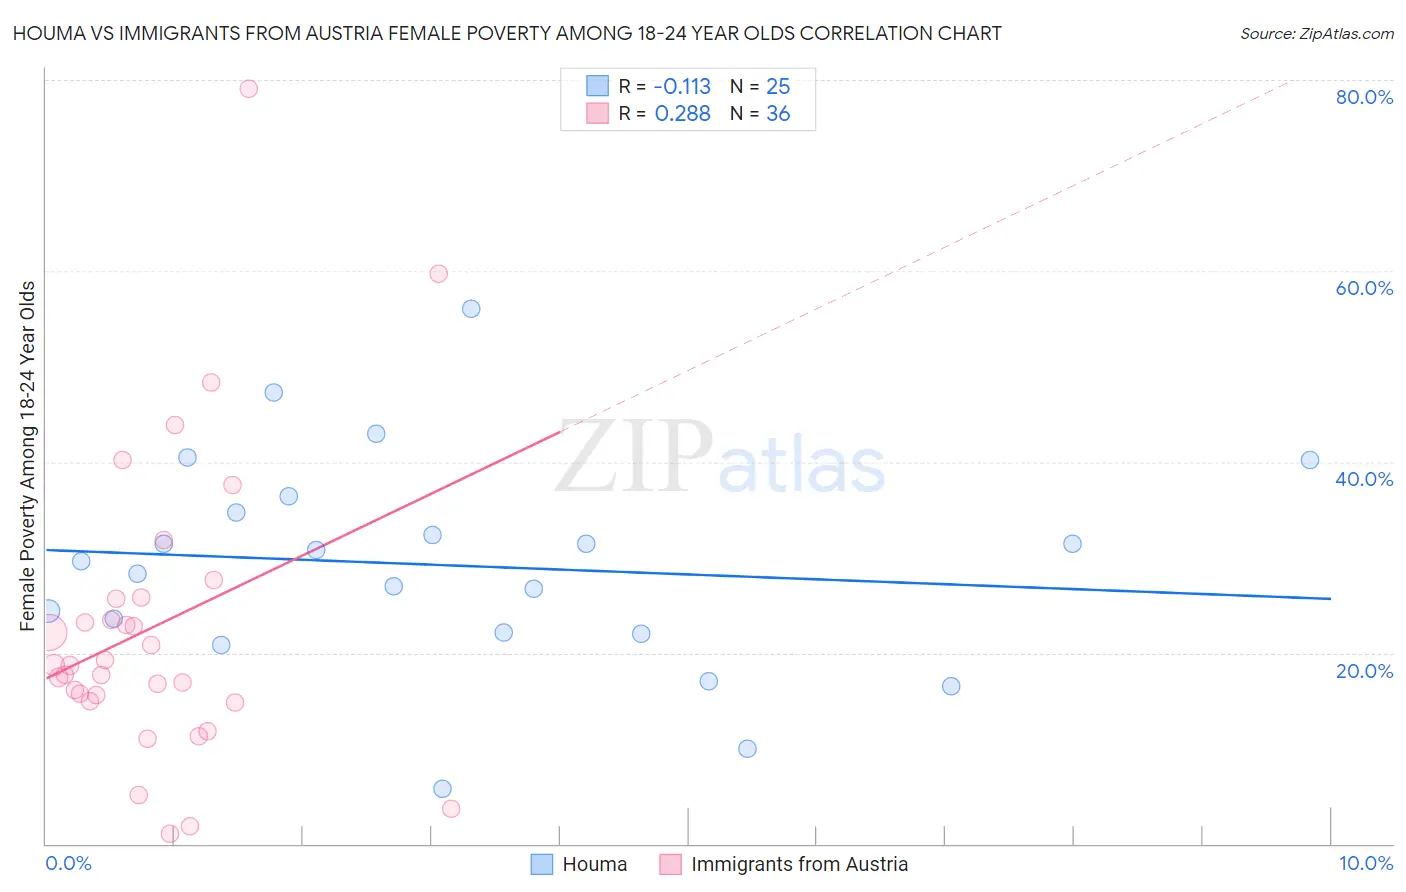
Houma vs Immigrants from Austria Female Poverty Among 18-24 Year Olds Correlation Chart
The statistical analysis conducted on geographies consisting of 36,618,001 people shows a poor negative correlation between the proportion of Houma and poverty level among females between the ages 18 and 24 in the United States with a correlation coefficient (R) of -0.113 and weighted average of 26.2%. Similarly, the statistical analysis conducted on geographies consisting of 165,272,500 people shows a weak positive correlation between the proportion of Immigrants from Austria and poverty level among females between the ages 18 and 24 in the United States with a correlation coefficient (R) of 0.288 and weighted average of 19.7%, a difference of 32.8%.
Female Poverty Among 18-24 Year Olds Correlation Summary
| Measurement | Houma | Immigrants from Austria |
| Minimum | 5.7% | 1.0% |
| Maximum | 56.0% | 79.1% |
| Range | 50.3% | 78.0% |
| Mean | 29.2% | 22.8% |
| Median | 29.6% | 18.7% |
| Interquartile 25% (IQ1) | 22.1% | 15.3% |
| Interquartile 75% (IQ3) | 35.5% | 25.7% |
| Interquartile Range (IQR) | 13.5% | 10.4% |
| Standard Deviation (Sample) | 11.3% | 15.8% |
| Standard Deviation (Population) | 11.1% | 15.6% |
Similar Demographics by Female Poverty Among 18-24 Year Olds
Demographics Similar to Houma by Female Poverty Among 18-24 Year Olds
In terms of female poverty among 18-24 year olds, the demographic groups most similar to Houma are Apache (26.3%, a difference of 0.53%), Chippewa (25.9%, a difference of 1.0%), Immigrants from Somalia (25.7%, a difference of 1.7%), Cajun (25.7%, a difference of 1.9%), and Pueblo (26.9%, a difference of 2.8%).
| Demographics | Rating | Rank | Female Poverty Among 18-24 Year Olds |
| Immigrants | Saudi Arabia | 0.0 /100 | #325 | Tragic 25.3% |
| Yakama | 0.0 /100 | #326 | Tragic 25.3% |
| Ute | 0.0 /100 | #327 | Tragic 25.4% |
| Natives/Alaskans | 0.0 /100 | #328 | Tragic 25.4% |
| Cajuns | 0.0 /100 | #329 | Tragic 25.7% |
| Immigrants | Somalia | 0.0 /100 | #330 | Tragic 25.7% |
| Chippewa | 0.0 /100 | #331 | Tragic 25.9% |
| Houma | 0.0 /100 | #332 | Tragic 26.2% |
| Apache | 0.0 /100 | #333 | Tragic 26.3% |
| Pueblo | 0.0 /100 | #334 | Tragic 26.9% |
| Yup'ik | 0.0 /100 | #335 | Tragic 27.0% |
| Immigrants | Yemen | 0.0 /100 | #336 | Tragic 27.5% |
| Cheyenne | 0.0 /100 | #337 | Tragic 28.1% |
| Hopi | 0.0 /100 | #338 | Tragic 28.2% |
| Pima | 0.0 /100 | #339 | Tragic 28.4% |
Demographics Similar to Immigrants from Austria by Female Poverty Among 18-24 Year Olds
In terms of female poverty among 18-24 year olds, the demographic groups most similar to Immigrants from Austria are Immigrants from Bosnia and Herzegovina (19.7%, a difference of 0.050%), Canadian (19.7%, a difference of 0.060%), Immigrants from Northern Africa (19.7%, a difference of 0.090%), Slavic (19.7%, a difference of 0.12%), and Panamanian (19.7%, a difference of 0.13%).
| Demographics | Rating | Rank | Female Poverty Among 18-24 Year Olds |
| Immigrants | Trinidad and Tobago | 85.6 /100 | #140 | Excellent 19.7% |
| Pennsylvania Germans | 85.5 /100 | #141 | Excellent 19.7% |
| Panamanians | 84.6 /100 | #142 | Excellent 19.7% |
| Slavs | 84.4 /100 | #143 | Excellent 19.7% |
| Immigrants | Northern Africa | 84.1 /100 | #144 | Excellent 19.7% |
| Canadians | 83.8 /100 | #145 | Excellent 19.7% |
| Immigrants | Bosnia and Herzegovina | 83.6 /100 | #146 | Excellent 19.7% |
| Immigrants | Austria | 83.1 /100 | #147 | Excellent 19.7% |
| Immigrants | Latin America | 81.3 /100 | #148 | Excellent 19.7% |
| Immigrants | Oceania | 81.2 /100 | #149 | Excellent 19.7% |
| Syrians | 80.2 /100 | #150 | Excellent 19.8% |
| Immigrants | Eastern Asia | 79.7 /100 | #151 | Good 19.8% |
| Yugoslavians | 79.0 /100 | #152 | Good 19.8% |
| Immigrants | Japan | 78.1 /100 | #153 | Good 19.8% |
| Immigrants | Zimbabwe | 76.7 /100 | #154 | Good 19.8% |